Dávid Dobák & Brigitta Szilágyi
Investigation of engagement and performance among female and male students in technical Higher Education
Introduction
From the publication titled "Women and Men in Hungary," released by the Central Statistical Office in 2020, we can learn that in Hungarian higher education, although not by a significant margin, the proportion of women is already higher than that of men. However, there are significant variations across different fields of study. In the case of engineering sciences, the proportion of men is 73.4%, which means that out of the 30,388 students studying in this field in 2019, 22,305 were men. The difference is even more significant in computer science, where 84.2% of all students (16,796) were men in 2019. According to data from the National Center for Education Statistics (NCES), in the 2019-2020 academic year, women accounted for only 24% of university engineering students in the United States. In the same year, women represented 46% of undergraduate students, indicating that they are significantly underrepresented in technical fields compared to their enrollment in higher education [1].
Due to the COVID-19 pandemic, it was expected that student enrollment would decrease, but there was no significant decline in engineering higher education. The population we examined began their tertiary studies in 2022, with the majority coming to the Budapest University of Technology and Economics after completing high school. It means that the pandemic impacted their studies during the 10th and 11th grades of high school, presenting challenges for students and educators. Educational institutions had to learn to use new digital platforms and plan their curriculum accordingly. Online education also brought new opportunities, allowing us to build on digital platform proficiency even after the pandemic subsided. However, distance learning posed challenges for students as well: they had to adapt to a new learning environment and, in many cases, needed more resources to participate in high-quality online education [2, 3, 4].
We have examined the impact of the COVID-19 pandemic on the knowledge level of first-year students in the recent period [5, 6].
While we anticipated that there would be knowledge and skill-related issues following the pandemic, we could not foresee how it would evolve. Currently, we observe that the most significant impact is evident among those who entered in 2022. It may be because, in March 2020, when online education was introduced, the graduating students had essentially completed the high school curriculum, while those entering in 2022 were still in the foundational process. It was noticeable that our students faced more difficulties with the first-semester calculus course. Their performance on quizzes and exams confirmed it. It motivated us to conduct further assessments at the beginning of the second semester before continuing with the calculus course.
At the beginning of the semester, we administered a commitment questionnaire to our students to assess their attitudes towards the university, the mathematics course, courses that actively use mathematics and courses that do not involve mathematics. The other questionnaire focused on the Student's relationship with mathematics, containing questions about their attitudes and experiences with the subject.
The studied population and the available data
The studied population consists of first-year students in mechatronics engineering and energy engineering at the Budapest University of Technology and Economics in September 2022. These programs attract competent students, with admission cutoff scores of 348 for energy engineering and 429 for mechatronics engineering. The students completed two tests, one related to attitude and the other to commitment, and additional data about them were available (e.g., final math grades for the semester). The students completed the tests and provided the data during their first semester of education at the university. The proportion of female students is approximately one-sixth of the male students. The detailed breakdown of the distribution by gender and program can be found in Table 1. This table includes only students who have complete data, meaning those who completed both tests and for whom the aforementioned basic data are available.
1. table Respondents distributed by gender and major
|
All |
124 |
|
|
Females |
17 |
|
|
Males |
107 |
|
|
Energy engineers |
43 |
|
|
Mechatronics engineers |
81 |
|
|
Females |
Males |
|
|
Energy engineers |
9 |
34 |
|
Mechatronics engineers |
8 |
73 |
Statistical characterization of the population
In this section, we will provide a detailed overview of the population by examining various statistical indicators. One of the most important data fields for us is the final mathematics grade. It is crucial because while completing questionnaires primarily provides data for research, the grades significantly impact the students' future (e.g., scholarships, allocation of dormitory places, specialization choices). Therefore, we can assume that students exerted their best efforts and were motivated to achieve their grades. Thus, we do not need to consider the demotivation factor in our calculations. The average of the mathematics grades is 3.323, with a standard deviation of 1.254, and their distribution is illustrated in Figure 1.
1. figure The distribution of the mathematics grades
In the questionnaire, the respondents were also asked to indicate how many 90-minute mathematics classes they had per week. In the regular calculus course, there are two sessions per week, consisting of a 90-minute lecture and a 90-minute seminar. However, students have the opportunity to attend an additional 90-minute practice course as well as two different talent development courses. Many students took advantage of the extra practice options, which further demonstrates their desire to master the subject material at an adequate level. 75% of students take more than three mathematics classes per week, indicating their enrollment in additional mathematics courses (either talent development or remedial). Among mechatronics engineering students, 71.6% have more than three mathematics classes, while the proportion is 81.4% among energy engineering students. The distribution by gender is as follows: 76.6% among males and 64.7% among females.
The commitment questionnaire consisted of a total of 40 questions. The questions were rated on a six-point scale (1-6). Ten questions were related to general university commitment, 10 to commitment towards mathematics classes, 10 to science subjects, and 10 to commitment towards humanities and other subjects. For each category, we calculated the average score based on the responses to the respective ten questions, representing the commitment level of the given population. Additionally, we determined the overall average score for all the questions. Figure 2 illustrates the comparison of results between the two majors (energy engineering and mechatronics engineering).
2. figure Comparison of commitment levels of energy engineering and mechatronics engineering students in a radar chart
It can be observed that the values almost overlap for both groups, indicating that further search for statistically significant correlations is unnecessary. Figure 3 displays the distribution of results similarly comparing male and female students as before.
3. figure Comparison of commitment levels between male and female engineering students in a radar chart
Similar to Figure 2, no significant difference can be observed between the two groups here as well. Therefore, we can conclude that commitment is not significantly influenced by gender or field of study.
The aptitude test consisted of 24 questions using a six-point scale (1-6). These questions monitored both positive and negative attitudes, so when calculating the attitude score, they were averaged with their respective signs taken into account. The aptitude test results can be seen in Table 2, presenting the average scores of the positively and negatively oriented questions.
2. table Means of attitude test (positive, negative, differential)
|
Positive mean |
Negative mean |
Difference mean |
|
|
Value |
39.444 |
31.524 |
7.919 |
The standard deviation of positive scores is 6.141; for negative scores, it is 9.014; and for differential scores, it is 12.618. Therefore, a value can be associated with attitude, which can be further decomposed into a positive and a harmful component. It is worth examining the correlation between these three values (positive, negative, and differential attitude) and the mathematics grades. These values are presented in Table 3.
3. table The values of correlations with grades
|
Number of hours-grade |
0.127 |
|
Commitment (mean)-grade |
0.146 |
|
Attitude (positive)-grade |
0.307 |
|
Attitude (negative)-grade |
-0.220 |
|
Attitude (differential)-grade |
0.307 |
As a reference, the correlation between the number of hours spent on studying and the grade (average) shows an absolute value greater than 0.1 but less than 0.15, indicating a very weak correlation. In contrast, the correlation value of -0.220 between negative attitude and grade indicates a slightly higher magnitude of negative correlation, while the correlation values of 0.307 between positive attitude and grade and between differential attitude and grade are statistically significant. It is important to note that the coincidence of the latter two values is not due to mere chance. The positive attitude also shows a weak positive correlation, so it would be expected that the differential attitude, which is an indicator of negative attitude as well, would exhibit a higher level of covariance with grades. However, in this population, a canceling effect occurs, and the increase in correlation is not manifested. Based on the above, a statistically significant correlation exists between positive, optimistic attitude and good grades.
Methodology
A possible method for analyzing the data is as follows: From the various fields of data, we select at least two that we want to examine. Then, based on one of the data fields, we divide the sample into two groups (exceptionally straightforward if the dividing field is binary). It gives us two different samples to perform a two-sample t-test. This test is used to determine whether the means of the two samples differ significantly (assuming they come from the same distribution). If they do, further investigations are justified on the samples to determine the cause of the difference. The null hypothesis of the two-sample t-test is that the two samples are statistically equivalent. We assume that the distributions of the samples are expected, and if this assumption is not met, the distribution should be corrected. Another requirement for the two-sample t-test is that the variances of the two samples are equal. This condition is tested using an F-test. The null hypothesis in this test is that the two samples, following a normal distribution, have equal variances. If we accept the null hypothesis after the test, then we proceed with the t-test.
Comparison by genders
The most obvious comparison is to examine academic performance based on gender. The trend of fewer women studying and working in STEM fields than the gender ratio would suggest is slowly diminishing even in countries that prioritize gender equality [7]. For example, Finland's indicator in this category is 30.5%. Interestingly, Hungary's rate of 32.63% is considered good globally, although, among European Union countries, we only surpass Finland and Luxembourg. The better position on the list of all countries is not surprising, considering that some countries still restrict women's participation in higher education. Among the 27 EU countries, only five (Norway 55.07%, Lithuania 54.96%, Latvia 52.71%, Denmark 51.72%, and Bulgaria 50.14%) have achieved a female representation of fifty percent in engineering and scientific careers. In many countries, including Hungary, it is common for women to receive less pay for the same work. Therefore, the comparison is interesting and relevant from this perspective. The question may arise as to how the predominantly minority group of female students (which is particularly true for the population we are examining) may influence their results.
In most cases, this would likely have a negative rather than positive impact on female students. However, at BME, the students already represent a select group. Typically, the best high school students with high entrance exam scores and advanced math or physics exams come here to prove their competence at the university. This desire to prove themselves can result in minority students (in this case, women) performing even better than their male classmates.
According to Figure 4, the distribution of grades does not follow a normal distribution, contrary to what is required for the procedure described in the Methodology section.
4. figure The distribution of grades by gender
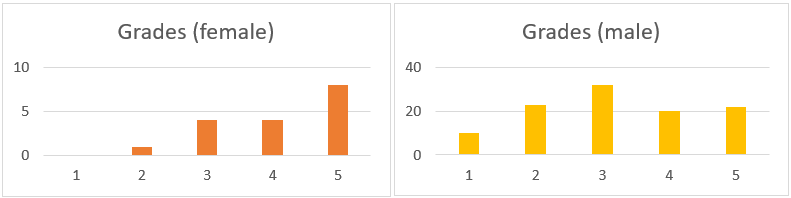
In both cases, a curve indicating a normal distribution can be observed, but there is a significant overlap of grades at the top mark. Deviation from the normal distribution can often indicate an external influence. Richard Quinn, a professor at the University of Central Florida (UCF), observed a similar phenomenon while grading papers. The familiar distribution suddenly showed a more minor standard deviation and a higher mean. He confronted the students with these highly unlikely results, and they later admitted to cheating. Of course, external influences do not always imply cheating. In the population we examined, it is much more likely to be a form of saturation (since a grade of six cannot be given to students who perform exceptionally well). To conduct the tests, we need to separate the normal distribution from this disturbance. In doing so, we obtain distributions in Figure 6 that can be considered genuinely normal.
5. figure The distribution of grades by gender (corrigated)
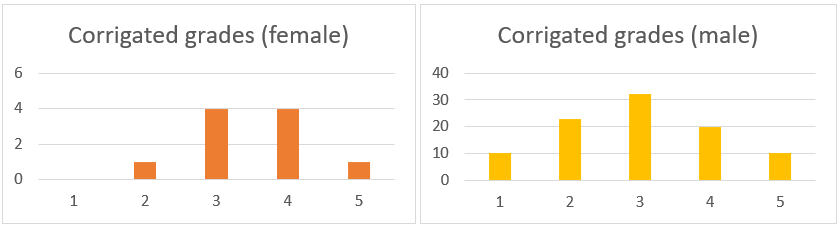
First, let's perform the F-test! The null hypothesis is: H_0: σ_M^2=σ_F^2 (M: male, F: female). A tapasztalati átlagok a következő módon számíthatók:
where m^* and f^* represent the number of males and females in the adjusted samples. Based on the data, m^*=95 és f^*=10, and the sample means are M ̅=2.968 and F ̅=3.5. The sample variances can be calculated as follows:
Performing the calculations, we have S_M^2=1.2842 and S_F^2=0.65. From this, F_emp=(S_M^2)/(S_F^2 )=1.976. According to the F-distribution table at a 5% significance level, F_krit=2.759. Since F_emp≤F_krit, we accept the null hypothesis, indicating that the variances of the two samples are equal.
The next step, after checking the equality of variances, is to perform the two-sample t-test. The null hypothesis is: H_0:E(M)=E(F), meaning that the means of the two samples do not significantly differ. The t-value can be calculated using the following formula:
After performing the calculation t=-1.4435. According to the Student's t-distribution table, for m^*+f^*-2=103 degrees of freedom at a 5% significance level, the critical value is t_p=1.29. Since |t|≥t_p, we do not accept the null hypothesis, indicating that the two samples differ significantly at a 5% significance level.
Conclusion: Girls performed statistically significantly better than boys.
A commonly perpetuated myth is that girls are less interested in STEM fields. However, multiple studies have shown that girls are just as interested in these areas as boys, but stereotypes can deter them. Research has also shown that outside of school, such as in coding clubs and robotics teams, girls participate in STEM activities with equal likelihood as boys.
Another misconception is that girls need to be more talented in technical fields. There is no evidence to support this claim. Studies consistently demonstrate that girls perform just as well as boys in STEM subjects, and in fact, girls outperform boys in these topics. According to a study published in the Science Journal, girls performed equally well as boys on standardized scientific and engineering skills tests but were less confident.
The results presented by us can also help dispel general misconceptions about girls' abilities in technical fields. Ultimately, the goal is to create a fairer and more supportive environment for girls and women in technical education and careers. However, the low representation of female students in STEM fields means that a large portion of the workforce is not benefiting from the opportunities female employees provide, and the industry and technological development needs to catch up in harnessing female talent.
Conclusion
In our article, we conducted fundamental statistical analyses of the population. We found that contrary to stereotypes, women can perform well in STEM fields and, in some cases, even outperform their male counterparts. It does not imply that someone is inherently smarter based on their gender, but it does debunk the assumption that men have a clear intellectual advantage in STEM fields. It is an important conclusion, as numerous studies today examine gender performance and its correlation with pay differentials.
In our further research, we will also employ artificial intelligence algorithms to uncover complex and hidden correlations.
Bibliography
[1]: Fast Facts, IES-NCES. Most popular majors https://nces.ed.gov/fastfacts/display.asp?id=37 (Last download: 2023. 05. 14.)
[2]: Sipos, B., Berezvai, Sz., & Szilágyi, B., (2022). Changes in learning strategy and learning time in the wake of the pandemic, In: SEFI 2022 50th Annual Conference of The European Society for Engineering Education Proceedings: Towards a new future in engineering education, new scenarios that European alliances of tech universities open up, Barcelona, Universitat Politécnica de Catalunya, pp. 720-728.
[3]: Kuhfeld, M., Soland, J., Tarasawa, B., Johnson, A., Ruzek, E., & Liu, J., (2020). Projecting the Potential Impacts of COVID-19 School Closures on Academic Achievement, Educational Researcher 49,8: 549–565. https://doi.org/10.3102/0013189X20965918
[4]: M. Kaffenberger, (2021). Modelling the long-run learning impact of the Covid-19 learning shock: Actions to (more than) mitigate loss, International Journal of Educational Development, 81, 102326. https://doi.org/10.1016/j.ijedudev.2020.102326
[5]: Sipos, B., & Szilágyi, B., (2022). Investigation of processing test results based on knowledge similarity In: Järvinen, Hannu-Matti; Silvestre, Santiago; Llorens, Ariadna; Nagy, Balàzs (Eds.) SEFI 2022 50th Annual Conference of The European Society for Engineering Education Proceedings: Towards a new future in engineering education, new scenarios that European alliances of tech universities open up, Barcelona, Spain: Universitat Politécnica de Catalunya, pp. 710-719.
[6]: Berezvai, Sz., Oláh, T., Pálya, Zs., Sipos, B., & Szilágyi, B., (2020). A tanulási folyamat időbeli eloszlásának és eredményességének vizsgálata a kalkulustanulásban, Opus et Educatio 7 (4), pp. 1-10.
[7]: Jacobs, K. (2021). Norway has Europe's highest share of women scientists and engineers. https://bigthink.com/strange-maps/women-in-science/ (Last download: 2023.05.14.)