
Tamás KERSÁNSZKI – Tibor BARÁTH – Ágnes FAZEKAS
Learning organization – learning school
Results of a Longitudinal Learning Organization Research Project
In the present study, we provide insight into the results of our research examining the functioning of schools as a learning organization. The research was carried out between 2015 and 2021 at the Hungarian-Netherlands School of Educational Management of the University of Szeged.[1] The related exploratory work sought to answer the question of what factors may be the most important in the operation of schools that can effectively support student achievement and how these factors change over time.
This is the first paper to report results, based on our longitudinal analyzes, so our primary goal here is to highlight the potential of our models and databases. In the following, we first present the essential features of the research. Then we describe our theoretical models created to grasp the functioning of schools as a learning organization. We then provide an insight into the first longitudinal results of the exploration work, relying primarily on quantitative data. We present the extent to which the factors defined by the theoretical models characterize the range of institutions studied and finally describe how this intensity has changed over the past five years based on the first analyzes.
At the beginning of the research, our primary goal was to create a model describing the operation of a learning organization, which can be used in practice to improve the efficiency, effectiveness, and competitiveness of schools. In the initial stage of the research, based on literature sources, we outlined an initial model, which we tested, formed, and reinterpreted after two data collection points. Given that our long-term intention was to develop schools within the University's catchment area, the related data collections took place among schools in the Southern Hungary region. In 2015 and 2020, we also carried out data collection, including questionnaires, case studies and workshops validating hypotheses and results. In 2015, data collection was conducted on a representative sample of schools in the region. The criteria for the selection of the sample were the following:
· Schools that consistently perform above average or are in continuous improvement at the National Competency Assessment.
· Schools that excel or perform well in different local or nationwide (mostly EU financed) development programs aimed to improve the quality of learning at schools.
In addition to these, we considered geographic coverage and sought to see all types of school maintainers appear. We combined different data collection tools during both rounds of data collection, and we also linked development elements to the research work. Part of our last activity was closely integrated into our multi-day case studies, which required the simultaneous presence of 2-3 researchers. Such fieldwork was carried out in the first phase of the research (2015) in a total of 6 institutions.[2]
During the questionnaire surveys, we asked the heads, deputy heads and teachers at the schools in the region to respond online and we prepared different questionnaires for them. We collected data from 1192 teachers, 119 deputy leaders, and 62 principals of 62 schools during the first data collection. During the second data collection, 986 teachers and 73 leaders returned a questionnaire suitable for analysis. During both data collections, we collected information on individual and organizational background variables, the expected and current state of the organizational characteristics related to the operation of the learning organization, and on the implementation of developmental and experimental activities. Given the specific pandemic context of the second survey, the questionnaire used here also included emergency adaptation and digital switchover questions.[3]
Our expectations for the model, developed during the research, was to:
· Outline as a theoretical model the organizational characteristics that most support efficient organizational operation and that are specifically valid in a public education environment.
· Support organizational conditions and institutional to be able to orient empiricism based on mixed research methods.
· Provide a basis for the development of organizational diagnoses and strategies,
· as a model that helps organizational development.
In order to develop the model, we explored the theoretical background of learning organizations, and we studied the relevant research. Figure 1 shows what factors were prominent as input for the learning organization when creating the model (Senge, 1990; Silins, Zarins & Mulford, 2002; Watkins & Marsick, 1996; Pol et al, 2012), and what influenced the efficiency of the link between leadership and learning outcomes (Louis et al, 2010; Day et al, 2009). To articulate a precise definition, we made a distinction between the concepts of organizational learning, learning organization and professional learning community. Several of the research projects confirmed that the schools characterized by the attributes of a learning organization tended to react more promptly to challenges; their efficiency increased (Corcoran & Goertz, 1995; Issacson & Bamburg, 1992; Louis, 2006; Silins, Zarins & Mulford, 2002; Strain, 2000; Schechter, 2008). Trust, cooperation and workplace learning became key elements of the organizational culture (Horváth, 2015) and in addition, network operation was considered essential (Hidding & Catterall, 1998; Huber 1991).
Figure 1.: Concept of developing learning organization model for schools
Source: Baráth, 2017
In addition to studying the professional literature, experience had a decisive role in developing the model. This meant a complex organizational diagnosis, which amalgamates the SWOT (Strengths, Weaknesses, Opportunities, Threats) analysis prepared by schools as self-diagnosis, the organizational culture and efficiency analysis built on the Competing Values Framework (Cameron & Quinn, 2011) with the exploration and analysis of the behavioural competencies of the organization’s key players (Baráth, 2013). The learning organization profile drawn up during the diagnosis served as the empirical foundation for developing the model (Baráth, 2015).
Based on the theoretical framework, we have created our model. The unique feature of this model is that it simultaneously shows the state of the schools' learning organizational operation that can be described at a given moment (synchronous approach) and the changes in the elements of the organizational operation over time (diachronic approach). The synchronous approach of the learning organization model (see the right side of Figure 2) describes the operation of the institution at a given moment along with seven key factors. These factors can be thought of as fundamentally determining the learning organizational nature of institutions. These are:
· Shared values, vision, and goals
· Knowledge sharing within the school
· Responsibility, cooperation, and trust
· Innovation, initiative and risk-taking
· Networking and partnerships
· Leadership supporting staff learning processes
· The development of learning-teaching processes, the management of learning organization problems, and the emergence of innovative classroom solutions.
The operation of the above factors can effectively help or drastically impede positive progress. Although the model displays these seven factors separately, in reality, it is difficult to draw sharp boundaries between them; they form a complex system of effects formed by complex and often difficult-to-sketch mechanisms.
In creating the second perspective (diachronic approach), we started from the premise that the dimensions defined in the first approach change due to evolutionary processes over time, and the individual characteristics of the learning organization become stronger or weaker. The diachronic approach to learning organization operation goes beyond the previous perspective by displaying the time dimension and evolutionary processes. This perspective (see the left side of Figure 2) can be used to capture the relationships, dynamics, and trends related to organizational change.
Figure 2: The synchronous and diachronic model of the learning organization
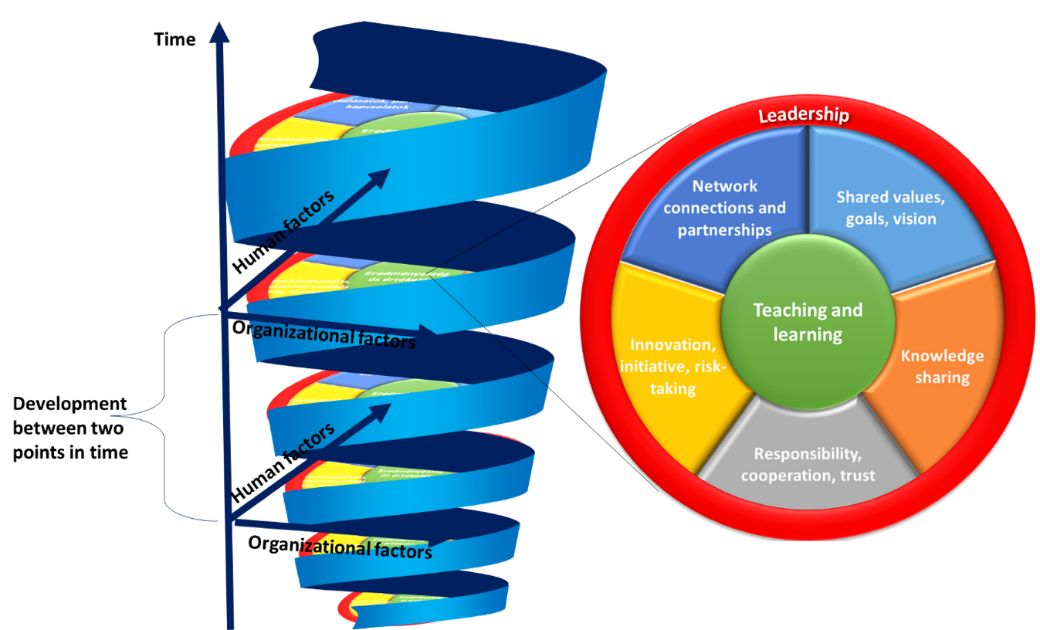
Source: Baráth, 2017
As mentioned earlier, we tested the validity of our model with different data collection procedures and analysis methods. Each of these seemed to justify the prominent role of all factors and their intense temporal formation. Confirmatory factor analysis of a key set of questions in our questionnaire also revealed a new model (Anka et al., 2015). This model shows factors that are particularly important for the functioning of the learning organization in the nuclear structure (see Figure 3). The model played a crucial role in developing the data collection tool used in the second wave of the research. It facilitated the selection of the variables involved in the longitudinal phase.
Figure 3: The validated model of schools as learning organization
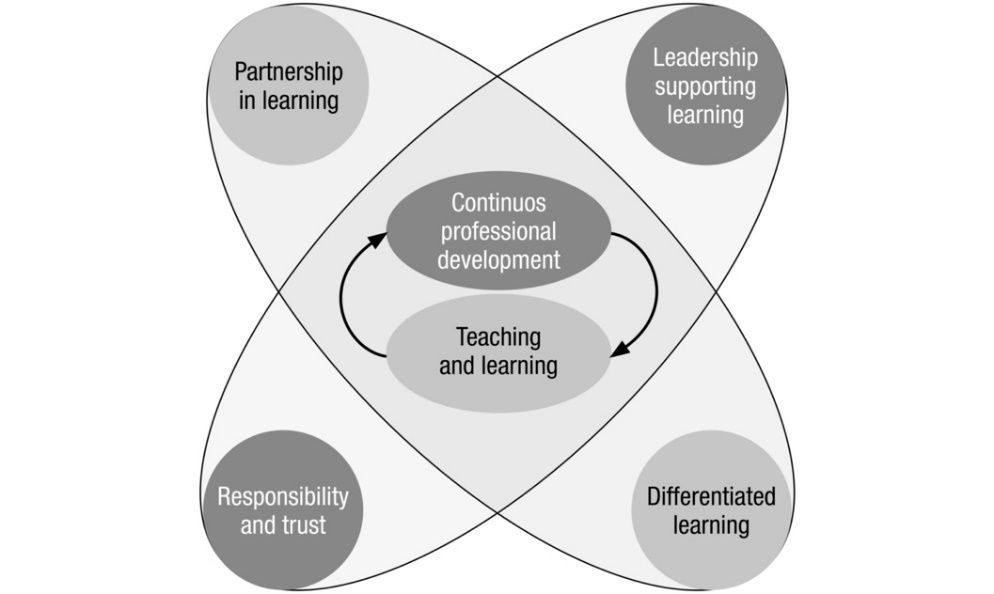
Source: Baráth, 2017
Our analysis, based on the second data collection, relied mainly on the diachronic approach shown in Figure 2 (left side). We focused on the renewal of teaching processes and the temporal formation of individual and organizational skills that enable this. Our starting point was that developmental processes could start from any point or level of the learning organization factors. Over time, through the complex system of effects of these factors, an increase in capacity is expected for other elements of the (synchronous) model.
Below, we show how intensive the presence of the elements of our model was (from a synchronous approach) among the schools surveyed based on our data collected last year. Our questionnaire contained 63 statements related to the elements of the synchronous approach of the model. Respondents were asked to rate on a scale of one to four how specific a particular statement is to the functioning of their school. In the following, we also describe the average values related to the seven elements of the model based on leader's and teacher's answers. Based on these, we get an idea of the assumed state of the model elements and we can also get to know the related sentence list of our questionnaires that can be used as a diagnostic tool. Although in this article our goal was not to make a statistical comparison of leaders’ and teachers’ responses, by presenting the two groups’ averages we get an idea about the presumed differences between their points of view too. This may provide a strong basis for further statistical analysis of our data.
The first element of our model described the learning-teaching process, which can also be considered as an indicator of the impact of learning organizational features (see 6 related dimensions of our model). In the questionnaire, the statements related to this dimension outlined a picture of classroom processes in line with the learning and teaching paradigms currently adopted. The diagram below (see Figure 4) shows no statements with an aggregate mean value below 3. Based on the aggregate averages (leader average: 3.43; teacher average: 3.45) overall satisfaction with classroom-level processes can be assumed among the respondent schools. The related items were arranged to determine how much difference could be observed between leaders’ and teachers’ opinions. The most significant differences were related to students' active classroom participation. For example, at the statement that "If the students do not understand something, teachers try different ways and methods to make the students understand the material." 69% of teachers, while only 35% of leaders marked the “Completely typical” choice.
Figure 4: Averages of variables related to learning and teaching dimension based on teacher and leader databases from the second data gathering
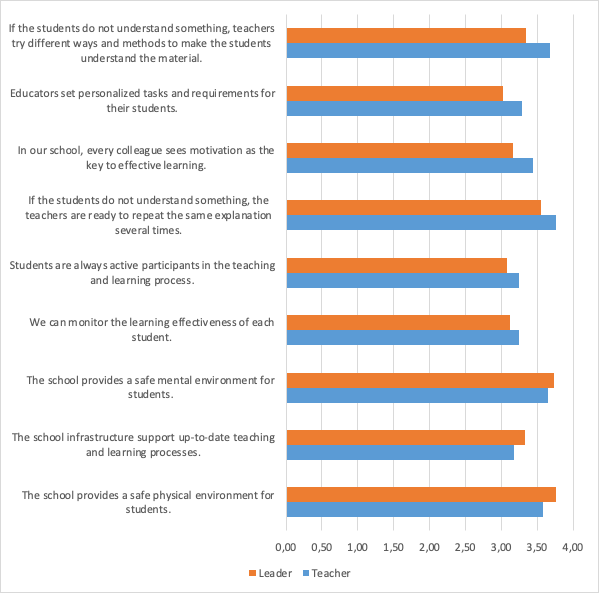
N. Leader= 57-64, N_Teacher= 753-901, Question: Please indicate how specific the following statements are to your institution (1: not at all; 2: rather not typical; 3: more typical; 4: completely typical).
We discuss leadership as the first of the model elements describing the operational features of learning organizations. The related items of the questionnaire were also positive statements, they outlined different dimensions of knowledge-focused leadership. The aggregated averages show that the schools surveyed presumably have already moved toward this type of institution management (leader average: 3.5; teacher average: 3.35), although it should be noted that voluntary involvement in research is necessarily reflected in these data. The examined population is presumably dominated by schools whose management considers it essential and valuable to participate in a learning organization research and development project. Within this dimension, the most significant difference was in the psychic support of work, the assistance of professional careers of teachers, and the promotion of innovative ideas. At the same time, it is essential to note that the opinions of the respondents regarding the reduction of barriers to work and the development of competencies in line with the goals developed very similarly according to our data (see Figure 5).
Figure 5: Averages of variables related to leadership dimension based on teacher and leader databases from the second data gathering
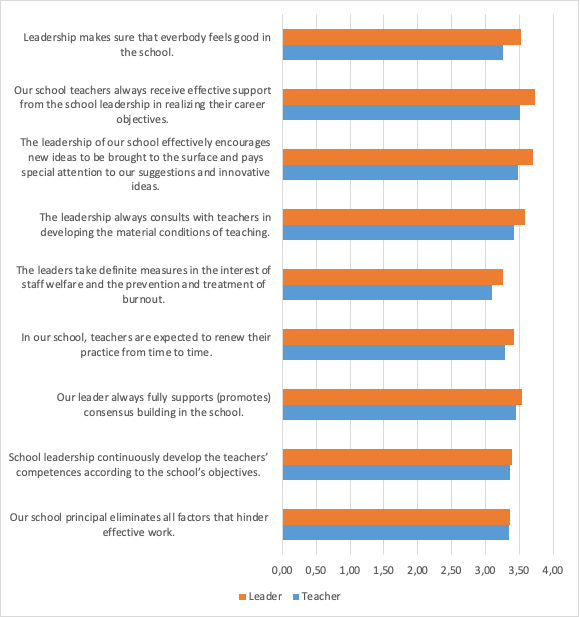
N_Leader = 57-64, N_Teacher = 753-901 Question: Please indicate how specific the following statements are to your institution (1: not at all; 2: rather not typical; 3: more typical; 4: completely typical).
The next element of our model was the dimension of common values, goals and vision; this is the organizational factor that determines whether the school can move in one direction. Our data show that responding teachers were more satisfied with the way common goals appear in everyday school life (leader average: 3.27; teacher average: 3.44). According to our data, they think that their work is carried out according to commonly agreed criteria, that colleagues are committed to a shared vision, and that a learning organization linked to a modern teaching approach is accepted. For example, with the statement that “Teachers always follow mutually accepted criteria when performing their activities.”, 51% of teachers fully agreed (marked “Completely typical”), while only 15.9% of leaders indicated this option. Given that most related statements appeared in the questionnaire regarding colleagues, it is not surprising that teacher responses show a more positive picture than data from their leaders. This is also evidenced by the fact that for the one item where we made the statement about the leader, the ratio is reversed (see Figure 6).
Figure 6: Averages of variables related to common goals and vision dimension based on teacher and leader databases from the second data gathering
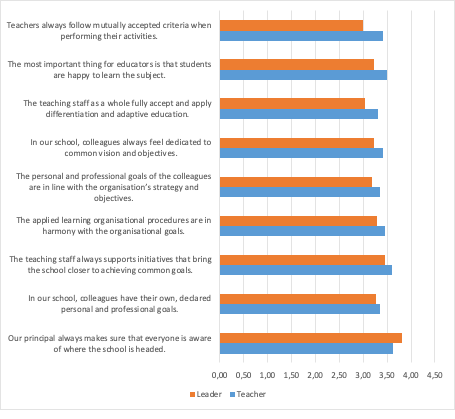
N_Leader = 57-64, N_Teacher = 753-901 Question: Please indicate how specific the following statements are to your institution (1: not at all; 2: rather not typical; 3: more typical; 4: completely typical).
The next area of the model was knowledge sharing. Within this, we focused on reflective teaching practices, cross-curricular topics and activities, motivation and willingness to workplace learning, knowledge sharing between student groups, and efficient information flow (see Figure 7). Lower averages appeared in this area for both teacher and leader responses (leader average: 3.04; teacher average: 3.18). For example, the level of the agreement did not reach the average of 3 in none of the respondent groups with the statement that "Teachers regard all feedback, reflection or criticism as an opportunity for further development." 24% of teachers and 8% of leaders fully agreed with this statement (marked “Completely typical”).
Figure 7: Averages of variables related to knowledge sharing dimension based on teacher and leader databases from the second data gathering
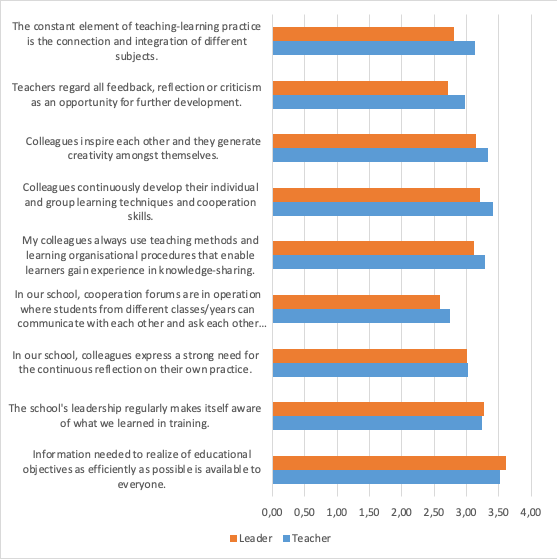
N_Leader = 57-64, N_Teacher = 753-901
Question: Please indicate how specific the following statements are to your institution (1: not at all; 2: rather not typical; 3: more typical; 4: completely typical).
The fifth element of our model measured the atmosphere and the cooperation between employees, as well as the shared responsibility embedded within these. We examined – for example – interpersonal relationships within the school, the autonomy of teachers, monitoring practices, and tracking learning outcomes at the individual level. The aggregate mean values related to this dimension were higher than value 3 at both teacher and leader level (leader average: 3.04; teacher average: 3.18). Our data show that self-evaluating or taking responsibility for students' individual development is less typical among examined institutions. While in the case of the former variable we could see more significant differences between the distribution of leaders’ and teachers’ responses (8% of leaders and 32% of teachers indicated that the corresponding statement is “Completely typical”), in the latter area teachers’ and leaders’ responses are less divergent (Figure 8).
Figure 8. Averages of variables related to responsibility, cooperation, trust dimension based on teacher and leader databases from the second data gathering
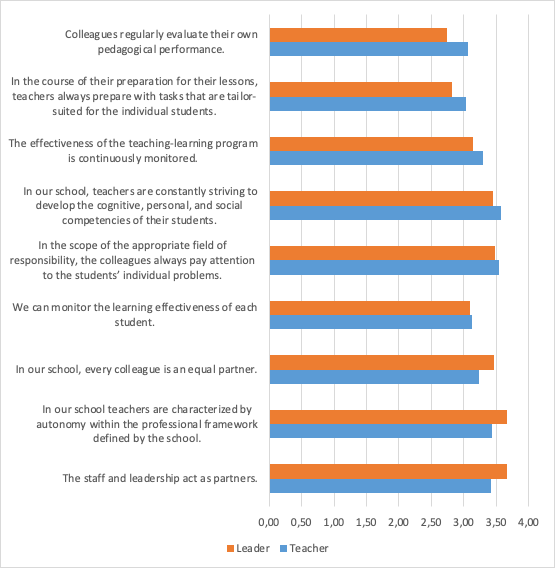
N_Leaders = 57-64, N_Teacher = 753-901, Question: Please indicate how specific the following statements are to your institution (1: not at all; 2: rather not typical; 3: more typical; 4: completely typical).
The next dimension focused on teachers’ learning within the school and internal knowledge sharing. Related statements revealed sub-areas such as risk-taking, development of pedagogical practice, or adaptation of new technologies. According to our data, this dimension was considered more characteristic than the previous ones by both leaders and teachers (leader average: 3.26; teacher average: 3.43). Among the examined institutions, the most decisive of the listed elements seems to be the striving for the regular renewal of teaching practices, which appears as a common goal on the one hand and as a leadership expectation towards colleagues on the other hand (see Figure 9). 47.5% of leaders and 58% of teachers indicated that they fully agree (marked “Completely typical”) with the statement that “In our school, one of the main objectives is to regularly renew our knowledge for continuous improvement.”.
Figure 9: Averages of variables related to innovation, initiative, risk-taking dimension based on teacher and leader databases from the second data gathering
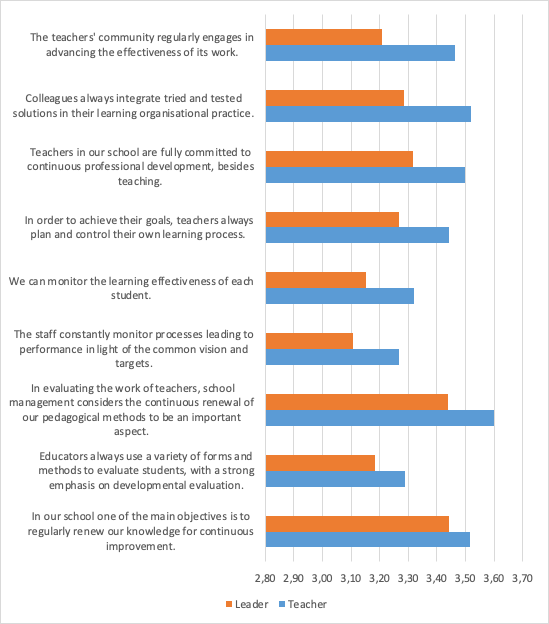
N_Leader = 57-64, N_Teacher = 753-901
Question: Please indicate how specific the following statements are to your institution (1: not at all; 2: rather not typical; 3: more typical; 4: completely typical).
Finally, the last component of our model was the partnership and network relations of the institutions. Following the first research phase results, we focused firmly on the items related to this dimension towards students as advocacy partners. Also, we left in the questionnaire those variables that try to capture the presence of the broader social environment and the search for good practices (also found in partner institutions). Our data suggest that the intensive activity in this area may be the most challenging field for schools and teachers (leader average: 2.96; teacher average: 3.15). After the first analysis of our data, we can assume that the examined institutions are still not characterized by joint work with partners; students rarely find themselves in a partnership position with a higher level of advocacy capacity, although they have a relatively large margin of manoeuvre. With the statement that “The student government plays a part in the evaluation of the teaching-learning process.”, 20% of teachers indicated that they fully agree (marked “Completely typical”). In comparison, only 5% of leaders were of this opinion (see Figure 10).
Figure 10: Averages of variables related to network and partnership dimension based on teacher and leader databases from the second data gathering
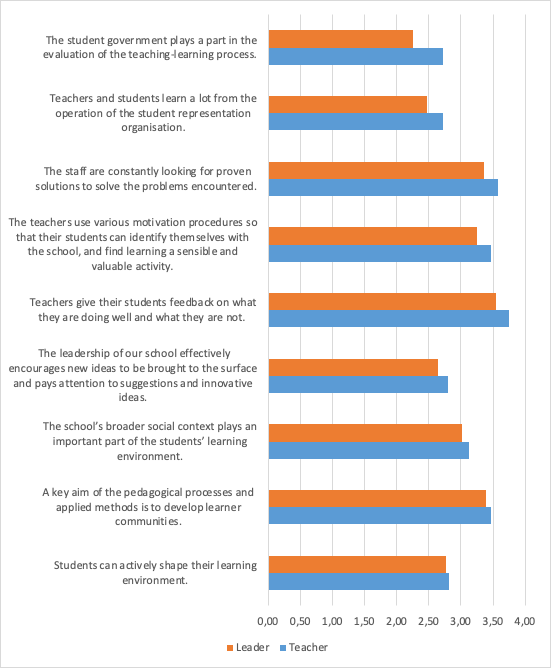
N_Leader = 57-64, N_Teacher = 753-901
Question: Please indicate how specific the following statements are to your institution (1: not at all; 2: rather not typical; 3: more typical; 4: completely typical).
According to the above data, the most minor developed learning organization element among the examined schools was networking and knowledge sharing. Each of the variables presented above was included in the teacher questionnaire of first-round data gathering, while roughly two-thirds were also included in leaders’ first questionnaire. Thus, it became possible to examine the changes in the elements of our theoretical model over the past five years among the institutions examined.
In order to examine changes of institutions’ learning organizational features, we created composite indicators for each of the above dimensions in both first and second, teacher and leader databases. The composite indexes were based on the average values of the statements related to the specific dimensions (i.e., to the 7 model elements). From the databases of the first surveys, we used for the composite indexes only those indicators that were included in the second surveys too.
At first, we analyzed the differences between the two teacher databases. The primary examination of these data suggests that there was a broadly balanced growth among the examined workplaces according to the 7 organizational features given by our learning organization model. According to our data, the most significant increase occurred in the least advanced “Knowledge sharing” area. Thanks to the composite indexes, we had the opportunity to compare the learning organizational features of respondent teachers’ workplaces in the spider-web diagram below (see Figure 11).
Figure 11: Distribution of composite indexes of 7 learning organization dimensions order based on teacher databases from the two data gathering
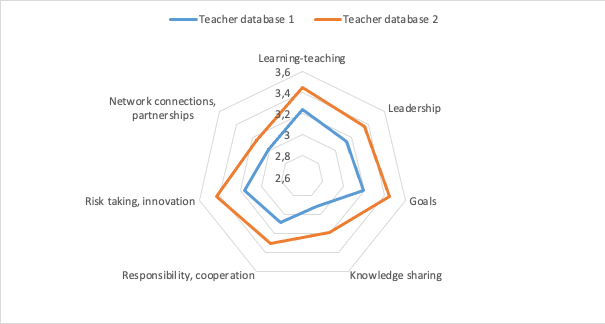 N_Teacher database 1=997-1132 N_Teacher database 2=753-901
A much more detailed picture of the growth of each dimension is shown when we look at the values of primary variables. Examining the variables showing the most significant displacement, we can see that serious increases can be observed within each dimension of our model. The figure below (see Figure 12) lists the 18 items with the most significant displacement in descending order of rate of increase. Observing the statements, we can see that the primary variables belonging to different groups according to the above categorization appear here. However, it is also clear that it is difficult to determine which dimension a variable is closest to. Thus, for example, the first two statements, which came under the heading of knowledge sharing due to our clustering, also characterize the dimensions of innovation risk-taking and responsibility-cooperation.
Figure 12: Averages of the variables showing the most significant changes in descending order based on teacher databases from the two data gathering
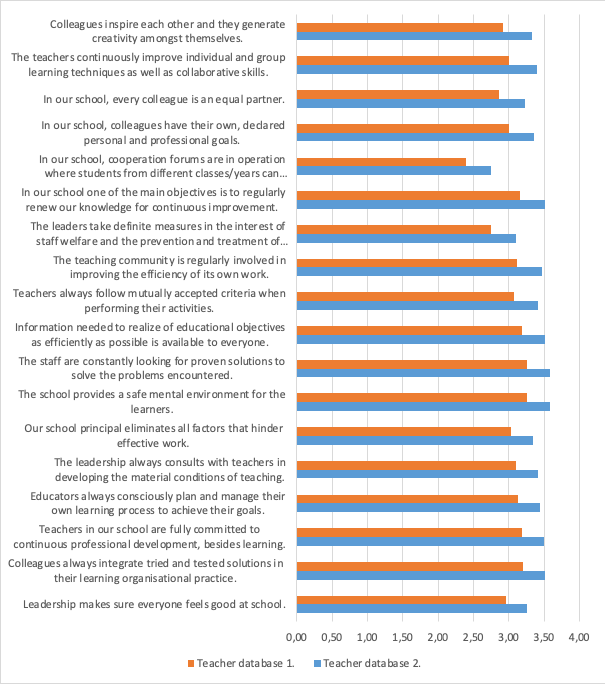
N_Teacher database 1=997-1132 N_Teacher Database 2=753-901
Although in this paper we aimed to present variables directly related to our learning organization model, it is important to note, that our databases provide an opportunity to capture changes in organizational functioning in other areas too. We may well rely on questions other than the issues presented above, which were included in both of our surveys and explore the specifics of the workplace environment or the organization's effectiveness from different perspectives. In addition, the question blocks of the second data collection that provide information about directly the change process can also lead to important findings. At the end of our study, we give a quick insight into one of these: the diagram below (see Figure 13) shows the average values of a block of questions that explores factors such as strengthening and weakening, conscious monitoring, and impact on the performance of the learning organizational features. Based on these variables, the institutions are expected to form important groups, on which we can rely further in-depth analysis. For example, organizations whose leader (instead) agreed (56%) and whose leader (somewhat) disagreed (34%) with the statement that "In the recent years our school has had so many tasks that there was no time and energy to deal with learning organizational operation."
Figure 13: Averages of variables related to learning organization operation based on leader database from the second data gathering
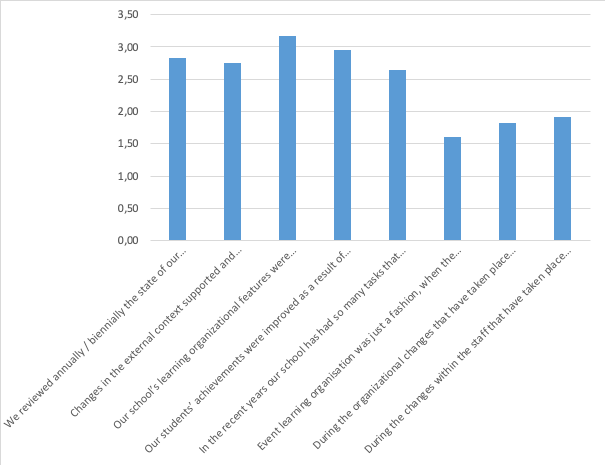
N = 58-61
Question asked: Please indicate how typical the following changes and events were for the operation of the institution. It was not characteristic at all (1), It was rather not characteristic (2), It was more characteristic (3), It was completely characteristic (4).
In this study, we presented the theoretical models that were created during our learning organization research, we described the measured intensity of the model elements in the examined institutions, and we provided insight into our first longitudinal results. Our databases are significantly more prosperous than the variables displayed here, but even this primary insight, revealed several important messages. The primary analyzes presented here illustrate clearly the direction and areas of the changes that have taken place in the last five years in learning organization characteristics among the examined institutions. It is also clear that we can rely well on our synchronous and diachronic model for analyzes focusing on the longitudinal dimension. After the first analysis of the data, it can be said, that the respondent teachers and leaders were typically satisfied with the quality and effectiveness of pedagogical work in the school; the most advanced of the learning organization dimensions were shared goals and vision, risk-taking and innovation willingness. Somewhat lacking is a sense of responsibility and collaboration, and more significantly, the dimension of knowledge sharing and partnerships. Nevertheless, in the case of all seven model elements, the examined schools (workplaces) indicated a somewhat balanced development; However, the most significant shifts of primary variables also predict that after analysis with advanced statistical methods, newer learning organization model alternatives will emerge.
· Anka Á., Baráth T., Cseh Gy., Fazekas Á., Horváth L., Kézy Zs., Menyhárt A. és Sipos J. (2016): Dél-Alföld megújuló iskolái. SZTE. Szeged.
https://www.researchgate.net/publication/284450256_Del-alfold_megujulo_iskolai
· Baráth, T. (2013): The Role Diagrammatic Approach. In: Kirkham, G., Révai, N. (eds.): The art and science of leading school – Central5: Central-European view on competencies for school leaders. Tempus Public Foundation, 219—225.
· Baráth, T. (2015): Learning organization as a tool for better and more effective schools. In: Procedia Manufacturing, Volume 3. Elsevier, USA, 1494—1502.
· Baráth, T. (2017): Leading learning school. In: Advances in Intelligent Systems and Computing Series, Volume 498. Kantola, Baráth, Nazir, Andre (eds.): Advances in Human Factors, Business Management, Training and Education. Springer, Switzerland. 1185-1198.
· Cameron, K. S., Quinn, R. E. (2011): Diagnosing and Changing Organizational Culture. Jossey-Bass, San Francisco.
· Corcoran, G., Goertz, H. (1995): Instructional Capacity and High Performance Schools. In: Educational Researcher, 17. 9. 27—31.
· Day, C., Pam Sammons, P., Hopkins, D., Harris, A., Leithwood, K., Gu, Q., Brown, E., Ahtaridou, E., Kington, A. (2009): The Impact of School Leadership on Pupil Outcomes. Final Report, University of Nottingham, England.
· Fazekas Ágnes (2020): Tanul a szervezet? A tanulószervezeti kutatás longitudinális elemzési lehetőségei. SZTE KÖVI. https://nevtud.ppk.elte.hu/content/produktumok-letoltheto-dokumentumok.t.5823?m=2668.
· Hidding, G. J., Catterall, S. M. (1998): Anatomy of a Learning Organization. Turning Knowledge into Capital at Andersen Consulting. In: Knowledge and Process Management, 5. 1. 3-13.
· Horváth, L. (2015): Informális tanulás a munkahelyen: a tudásmegosztás kompetenciájának fejlesztése. In: Kultúra és Közösség, 5. 3. 115-132.
· Louis, K. S. (2006): Changing the Culture of Schools. Professional Community, Organizational Learning and Trust. In: Journal of School Leadership, 16. 5. 477-489.
· Issacson, N., Bamburg, J. Can(1992): Schools Become Learning Organizations? In: Educational Leadership, 50. 3. 42-44.
· Pol, M., Hloušková, L., Lazarová, B., Novotný, P., Sedláček, M. (2012): Organizational learning in Czech.
· Senge, P. (1990): The Fifth Discipline. The Art & Practice of the Learning Organization. Doubleday, New York.
· Schechter, C. (2008): Organizational Learning Mechanisms. The Meaning, Measure, and Implications for School Improvement. In: Educational Administration Quarterly, 44. 2. 155-186.
· Strain, M. (2000): Schools in a Learning Society. New Purposes and Modalities of Learning in Late, Educational Management Administration & Leadership
· Silins, H., Zarins, S., Mulford, B. (2002): What characteristics and processes define a school as a learning organisation? Is this a useful concept to apply to schools? In: International Education Journal Vol 3, No 1, 24-32.
· Watkins, K. E. és Marsick, V. J. (eds) (1996): In action. Creating the learning organization. American Society for Training and Development, Alexandria.
[1] The research was carried out within the framework of the TAMOP-4.1.2.B.2-13 / 1 Program.
[2] During the first data collection, we prepared a separate questionnaire for the deputy head.
[3] See research reports for more information about our samples and tools: Anka et al, 2016; Fazekas, 2020.