Kinga HORVÁTH, Péter TÓTH
Application of QTI query to explore the opinions of teacher students of the Carpathian Basin about ideal teacher interaction
Applying Leary’s model in education
The examination of the impact exerted by teacher behaviour on pupils’ performance in a classroom environment is built on two early research fields. One is teacher effectiveness, and the other one is the examination of the interaction between individuals and their environment (Moos, 1979; Walberg, 1979). The most important finding of the latest 35-40 years of classroom researches is that the learning environment does have a decisive impact on learning (Dorman, 2003; Fraser, 1994). For example, in a study conducted in Singapore, Gohn and Fraser (1998) succeeded to find connections between the learning results and the patterns of teacher-pupil interactions. They organized a research series that was focused on classroom communication to explore the interpersonal relations between the teacher and the students (Wubbels – Brekelmans, 1998). The model developed by Watzlawick et al. (1967) gives a system-level approach to communication; this is the model that was used by Wubbels et al. when analyzing the interactions of pupil groups and their teachers. As a result of the system approach, the emphasis is put on the effects exerted by communication on the persons concerned. To get the pupils to form their evaluation of their teacher’s activity, Wubbels et al. (1987) applied the general model of interpersonal communication that served as the starting point for Leary’s (1957) work, as well. Even though the two dimensions were sometimes named in two different ways, they are apt to give a general description and evaluation of human interaction.
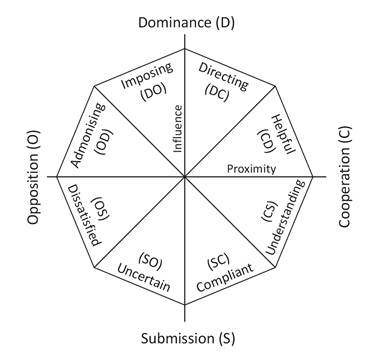
Thus, Wubbels et al. (1987) adapted Leary’s model in the educational context, so the horizontal axis presents the level of cooperation between the teacher and the students (closeness, proximity), while the vertical axis shows who directs the teacher-pupil relationship (influence, impact). The excessive values of the previous one are teacher cooperation (C) and teacher opposition or rejection (O). At the same time, that of the latter one are teacher dominance (D) and teacher subjection or submission (S).
Based on all this, Wubbels et al. (1987), similarly to Leary, described the eight personality variables of interpersonal behaviour. Following the circumplex logic, they arranged the variables along the circle's circumference; this way, the model for interpersonal teacher behaviour was made (Model for Interpersonal Teacher Behavior, MITB, Figure 1).
Figure 1: The MITB model
Source: Own figure after Wubbels et al. (1985), Fisher et al. (1995), Fraser et al. (2010) and Mareš – Gavora (2004)
Wubbels et al. (1985) found that there were two different aspects of characterizing teachers’ behaviour: methodological-educational and relationship. The methodological-educational aspect manifests in selecting, organizing and implementing the educational methods. The relationship aspect supports and ends in the creation of the classroom learning environment. The relation between the teacher and the pupils was found to be extremely important in the teaching-learning process.
The methodological-teaching aspect reflects the teacher’s vocational skills and professionalism, while the relationship aspect refers instead to his/her personality. In general, one of the factors is more dominant in the teacher’s behaviour towards the pupils. However, they are not independent of each other since the chosen methods, in most cases, influence the relationship with the pupils and may change its quality. According to all this, we can infer two things from the MITB model: the relationship between the teacher and the pupil and the assumption that the interaction style is influenced by the teacher’s personality. Based on the MITB and following Leary’s example, a measurement tool, a query was elaborated (Questionnaire on Teacher Interaction, QTI) to examine interpersonal teacher behaviour.
The results of the pilot research implemented at the Faculty for Teacher Training of János Selye University are in line with Wubbels et al.’s findings. The interviews made with the students showed it clear that each of them held in mind the good relations with their teachers, the teachers’ personality, communication and helpfulness as positive facts and experiences (Tóth-Bakos – Tóth, 2018). To develop teacher training at János Selye University, some researches are underway, in the framework of which we want to explore the individual characteristics of students (Zahatňanská – Nagy, 2020; Csehi – Kanczné Nagy – Tóth-Bakos, 2020).
Measuring interaction styles
The teacher’s interaction style can be described by various methods. One of these is the QTI (Questionnaire on Teacher Interaction) measuring tool, the predecessor of which was the Questionnaire for Interactional Teacher Behaviour, QUIT query created by Wubbels et al. (1985). The original QUIT query, which was based on the ICL (Interpersonal Check List) prepared by Leary (Demetrovics, 2007), consisted of 77 questions and was developed for Dutch secondary school students (Wubbels – Brekelmans, 1998; Wubbels et al., 1991; Wubbels et al., 1985; Wubbels – Levy, 1991).
Some surveys examine interpersonal behaviour in terms of attitudes towards school subjects. In Australian secondary schools, most of the QTI variables were found to be an insignificant correlation with the learning attitudes in terms of classroom lessons in biology (Fisher et al., 1995) and mathematics (Fisher – Rickard, 1998). The pupils’ attitudes towards the subjects were significantly positive in the classes where they felt that their teachers’ behaviour was more strong-minded, helpful and understanding. The interrelations between interpersonal teacher behaviour and pupils’ learning results were explored by den Brok, Brekelmans and Wubbels’ (2004) research.
Kövérová (2015) examined whether the secondary school students’ interpersonal behaviour was related to the emotions they experienced during the classroom lessons. She found that the strength of the pupils’ negative feelings could be related to the “imposingness” (DO) variable of interpersonal behaviour. The more imposing (dominant, unsatisfied) they perceived their teachers of mathematics and Slovakian language, the more often they felt anger, fear, sadness, guilt and shame. The positive perception of the lessons was related to the directing and helpful variables of interpersonal behaviour.
Fisher, Fraser and Creswell (1995) proved that the QTI query was apt to describe what picture the teachers had of the ideal teacher, of themselves and of how they were assessed by the pupils. In general, we can state that the teachers evaluated their behaviour statistically more positive than the pupils did. Examining the teachers’ interpersonal behaviour, a research conducted in Turkey (Telli et al., 2007) separated various interpersonal profiles.
The teacher-pupil relationship in terms of their attitudes concerning the subject (chemistry), their sex and skills (talent) was researched by Lang, Wong and Fraser (2005). They found that the behaviour of the teachers of chemistry was assessed significantly more optimistic concerning the helpful, friendly variable (CD) by the talented girls than by the boys with average endowments.
Other authors also assert that the gender of the research participants does have an effect on the evaluation of the teacher’s interpersonal behaviour. For example, according to research by Gavora, Mareš and den Brok (2003), female teachers seemed more persistent and determined and less unsure than their male colleagues. Examining the interaction style of teachers and class teachers teaching mathematics, Slovakian language and literature with the involvement of secondary school and 9th-grade pupils, Vašíčková (2015) refuted the above findings, saying that the pupils assessed the male teachers more helpful and less unsure than the female teachers, and were also more contented with them. She also found that the girls considered the teachers more positive than the boys did in terms of each variable. These findings lead to the conclusion that the teacher’s behaviour has a significant contribution to the creation of the right relationship in the class (Wubbels, 2014).
Several scientific papers and publications have been written about the translation and the adaption of the QTI measurement tool to various school levels. Den Brok et al. (2003) report on the comparative validity and reliability survey of the QTI measurement tools in multiple languages used in six countries (Netherlands, United States, Australia, Brunei Sultanate, Singapore and Slovakia). The adaption of the QTI to the Indonesian language and the needs of higher education were presented by Fraser, Aldridge and Soerjaningsih (2010) in their study. Bacete, Ferrá, Monjas and Marande’s (2014) study presents the adaption process to Spanish and the lower classes of primary school. The Slovakian version was prepared by Gavora, Mareš and den Brok (2003). The QTI was adapted to the Czech language by Mareš and Gavora in 2000; the peculiarity of this adaption was that the measuring tools consisted of 116 items (Mareš – Gavora, 2004). After a measurement implemented in the upper classes of primary schools, this query was modified to have 64 items by Lukas and Šerek (2009). The query indicated a high value in terms of reliability; the Cronbach-alpha value exceeded 0.9 in each sector, which could be considered an outstanding result. However, the construction validity (concept validity) of the test was low, which did mean a problem. During the construction validity test, the content relations of the measurement tool or scale are tried to be explored by defining teacher interaction as a psychological concept. The developers of the tool strive to turn the semantic information of the teacher interaction as a concept to be measured into an operational definition. The validity, in this case, means the extent to which the applied operational report covers the conceptual one. In case the two meanings overlap each other significantly, we speak of high-level construction validity. The correlation between the spesific sectors was only in partial accordance with the theory. As a result of further tests, a 59-item query was prepared (Lukas, 2010) and applied in the Czech Republic.
Researching interpersonal behaviour is a very exciting topic. The researches mentioned above point to and explore several correlations within the teaching-learning process that make sure that the teaching-learning process will be explained in the light of new elements and applying a holistic perspective. It is an exciting research field also because it has proved to be an adequate screening method that contributes to the immediate feedback of the teacher-pupil relationship and the self-reflection of teacher behaviour (Lukas, 2005) and the qualitative improvement of the teacher-pupil relationship or the teacher’s professional development (Fisher – Fraser – Creswell 1995; Fisher – Rickards 1998).
Process of the Hungarian adaption of the QTI
Similarly to Leary’ model, Wubbels et al. (1985, 1987) filled the area between the two axes with different personality characteristics according to how they appear in interactions and placed them in a circular diagram. The octagonal figure generated this way is made of eight triangle-shaped parts that are called sectors. These sectors or variables represent the teacher’s interaction behaviour (Figure 2).
The order of the sectors is not random; the expressions of behaviour defined by the sectors next to each other stand closer than those being farther. The sectors that are taking place opposite each other bear reverse personality characteristics. And the industries that take the right angle (orthogonal) position compared to each other have no relationship (Mareš – Gavora, 2004).
Table 1: Explanation of the variables in the Hungarian version of the QTI
|
Name of the variable |
Description of the variable |
|
Resolute, decided, directing (DC) |
Warns what will happen; directs; organizes; assigns tasks; proposes solutions; explains; raises attention |
|
Helpful, unreserved, friendly (CD) |
Helps; shows interest; gets involved in processes; has a friendly and polite manner; has a sense of humour |
|
Understanding, benevolent, striving to make consent (CS) |
Listens carefully; behaves empathetically; shows trusts and understanding; is forgiving; urges to solve the conflicts; is patient and open |
|
Permissive, soft-hearted (SC) |
Offers space for independent work; waits until the class calms down; gives freedom together with responsibility; takes the pupils’ proposals into account |
|
Uncertain, undecided (SO) |
Does not intrude in processes; gets pushed into the background; apologizes; waits to see how things will go; admits to be the faulty one |
|
Dissatisfied, doubtful (OS) |
Waits until the class calms down; ponders and demands calmness; expresses his/her dissatisfaction; has an angry and sullen sight; always puts questions; criticizes |
|
Unconcerned, rebuking, warning (OD) |
Often angry and hot-tempered; likes to prohibit and to point to mistakes, scolds; punishes |
|
Strict, imperious (DO) |
Controls, tests strictly and evaluates the pupils; demands silence; disciplines the class; insists that the rules and regulations are observed |
|
Name of the variable |
Description of the variable |
|
Resolute, decided, directing (DC) |
Warns what will happen; directs; organizes; assigns tasks; proposes solutions; explains; raises attention |
|
Helpful, unreserved, friendly (CD) |
Helps; shows interest; gets involved in processes; has a friendly and polite manner; has a sense of humour |
|
Understanding, benevolent, striving to make consent (CS) |
Listens carefully; behaves empathetically; shows trusts and understanding; is forgiving; urges to solve the conflicts; is patient and open |
Source: own table after Fraser, Aldridge and Soerjaningsih (2010)
While making the Hungarian translation of the text, we strived to give the precise interpretation of the content of the words, so we applied double translation there and back and also involved practising teachers to check the terminology.
The names of the sectors indicated in Figure 1 refer to their content; however, to be more expressive, we also present more details in a table (Table 1).
Finally, we introduce the process of adapting the Hungarian version of the QTI and the relevant results of the pilot research.
Research objective, measuring tool and subjects of research
The question we searched to answer during our pilot research was: What do teacher-to-be think about the ideal teacher interaction manner?
In this study, we present the details of the process of adapting the Hungarian version of the QTI.
Interaction is considered an inevitable element and manifestation of social connection from a communication theoretical, psychological and sociological aspect, as well. Looking at the question from an educational point of view, we can state that the teaching-learning process is an interaction chain between persons. In the classroom, most of the interactions happen between the teacher and the pupil(s) (teacher-focused education). However, the interference between the pupils must be of great importance, as well (pupil focused education). The means of implementing interaction at school is classroom communication both in the verbal and the non-verbal dimension.
Table 2: Persons involved in the research
|
Institution |
nursery school teacher |
teacher of lower classes |
teacher |
nursery school teacher and teacher of lower classes |
Total |
|
János Selye University, Komarno (JSU) |
130 |
0 |
67 |
0 |
197 |
|
Ferenc Rakoczi II Transcarpathian Hungarian College of Hungarian Education, Berezhany (FRTHC) |
6 |
12 |
41 |
0 |
59 |
|
Partium Christian University, Oradea, (PCU) |
0 |
0 |
20 |
17 |
37 |
|
University of Novi Sad, Hungarian Language Teacher Training Faculty, Subotica, (UNS HLTTF) |
10 |
33 |
0 |
0 |
43 |
|
Total |
146 |
45 |
128 |
17 |
336 |
The QTI measuring tool lays the stress on the complex examination of the teacher-pupil interaction, and it does so in three evaluation dimensions:
· judgement of the ideal teacher interaction,
· pupils’ opinions about the interaction of the given teacher,
· the opinion of the given teacher about his/her own interaction.
In our research, we put the first dimension into the limelight, and applied the Hungarian version of the measuring tool published by Darrell Fisher, Barry Fraser and John Cresswell (1995). During the adaption, we paid special attention to having the tool translated by two experts there and back, to testing it several times and to having it critically examined.
In our research, we applied the 48-item version of the QTI.
The research involved 336 students of four Hungarian speaking teacher training institutions in four countries (Slovakia, Ukraine, Romania and Serbia) (Table 2).
The students’ demographical data were as follows:
· Grade: 1 – 69.6%; 2 – 26.8%; 3 – 3.6%
· Type of training: full-time – 84.5%; correspondence – 15.5%
· Sex: female – 82.4%; male – 17.6%
· Type of residency: village – 61.6%; small town – 32.1%; city – 6.3%
· Country of secondary school leaving exam: Hungary – 21.7%; Slovakia – 37.8%; Romania – 10.4%; Ukraine – 17.6%; Serbia – 12.5%
· Language of secondary school education: Hungarian – 89.0%; Slovakian – 3.0%; Ukrainian 2.7%; Serbian – 0.3%; bilingual, one of the Hungarian – 5.1%
· Type of secondary school: technical school – 51.8%; grammar school – 48.2%
· Own child: none – 88.4%; 1-2 children – 10.8%; 3 or more – 0.9%
· Existing higher grade qualification: none – 96.4%; BA – 1.8%; MA – 1.8%
· Place of stay during the studies: parents’ – 46.7%; sublet – 7.7%; hostel – 44.6%; relatives or friends’ – 0.9%
· Distance of residency from university: 0-10 km – 17.0%; 11-100 km – 64.9%; 101-200 km – 7.1%; 201-300 km – 6.8%; 301+ km – 4.2%.
The research had a double concrete objective. On one hand, to prepare and adapt the Hungarian version of the 48-item QTI query, and to map the opinions students attending teacher training had about the ideal interpersonal teacher behaviour on the other.
During the examination, we searched the answers to the following questions:
· How reliable can the measuring tool be considered in terms of certain sub-samples? Do the research results confirm the eight variables of the model?
· Can the results of the factor analysis be generalized?
Reliability of the measuring instrument
We took the reliability of the measuring instrument as a highlighted issue. This problem was faced by Fisher, Fraser and Cresswell already at the beginning of the 1990s. They compared the reliability of the 77-item query applied by Wubbels, Brekelmans and Hooymayers (1992) in the Netherlands and by Wubbels and Levy (1991; 1993) in the United States to their own 48-item version applied in Australia (Fisher – Fraser – Cresswell, 1995). The Cronbach-alpha values determined in the certain dimensions proved to be lower than 0.7 in two cases: in terms of the variable imposing, strict (DO) and its opposite: compliant, soft-hearted (SC). Reliability was 0.63 and 0.66 in these cases. The first two of the referred three types of research were focused on the assessment of the pupil-teacher interaction and the teachers’ self-evaluation, while the third one examined interactions only between the pupils. It can also be seen that, except for one case, the reliability of the Australian research was lower than the first two but exceeded the 0.7 level. There were 1105 pupils and 66 teachers involved in the Dutch research, 1606 pupils and 66 teachers in the American one and 489 pupils in Australia. These researches did not publish any data in terms of the third dimension.
The Cronbach-alpha reliability indicator is perfectly apt to be used for the examination of the inner consistency of the items constituting the given variables since it is defined as the arithmetical average of all of the inter-item correlation coefficients gained by split-half testing.
The professional literature takes the values 0.5 (Horváth, 1997) and 0.7 (Takács-Kárász, 2014) as the lower limit value of reliability or stability. A Cronbach-alpha above 0.9 can be considered a very high value that indicates that the values connecting to the variable are redundant, i.e. the same phenomena has been asked about several times. In our research, we took the domain between 0.6 and 0.9 as values acceptable from a reliability aspect.
Taking all this into consideration, we thought it was important to check the Hungarian version.
Each of the 8 octants in the 48-item QTI query included 6 items that were mixed up in the query. The examined person did not know which item belonged to which prototype of interpersonal teacher behaviour.
Table 3: The Cronbach-alpha values of the QTI octants
|
Prototypes of interpersonal teacher behaviour |
Full sample |
Sex male/female |
Training full time/correspondence |
Type of secondary school technical/grammar |
|
Directing, leading (DC) |
0.711 |
0.717/0.706 |
0.684/0.821 |
0.721/0.704 |
|
Helpful, friendly (CD) |
0.757 |
0.756/0.758 |
0.741/0.807 |
0.768/0.737 |
|
Understanding, open (CS) |
0.736 |
0.817/0.674 |
0.731/0.752 |
0.732/0.742 |
|
Transferring responsibility to pupils, giving freedom (SC) |
0.676 |
0.623/0.686 |
0.675/0.683 |
0.644/0.706 |
|
Uncertain, undecided (SO) |
0.768 |
0.857/0.712 |
0.765/0.787 |
0.804/0.679 |
|
Dissatisfied, doubtful (OS) |
0.756 |
0.795/0.739 |
0.742/0.817 |
0.770/0.733 |
|
Unconcerned, rebuking, confrontational (OD) |
0.688 |
0.778/0.634 |
0.709/0.641 |
0.740/0.675 |
|
Strict, imposing (DO) |
0.804 |
0.758/0.809 |
0.803/0.813 |
0.794/0.813 |
It is important to mention that reliability is strongly influenced by three factors: the homogeneity of the measured population, the number of the items and their scale. In this case, the population was made of students attending Hungarian speaking teacher training in the Carpathian Basin, most of them in the first grade. We used a five-grade Likert scale, and the number of the items belonging to one variable was 6 for all of the variables.
We presented the Cronbach-alpha reliability indicators in Table 3, and also presented the results by sub-samples. The variables that are opposite to each other in the QTI model have been put one under the other (Figure 2). In case we take only the nursery school teachers, the reliability of the variables of the query shift to the right in terms of almost each variable.
Based on the above, we can state that the Hungarian version of the 48-item QTI measuring tool can reliably assess the opinions formed about the ideal teacher interaction by the students taking part in teacher training in the Carpathian Basin.
Reliability test of the items by QTI variables
The 48-item QTI includes 8 variables, and each variable is connected to 6 items. By factor analysis, we checked whether the research results verified the assignment of the items to the variables.
First of all, we checked whether the variables were apt to be tested by factor analysis. The Kaiser – Meyer – Olkin number was 0.867, which could be considered as a very good result. The Bartlett test proved the aptness for factor analysis, as well (Khí-square= 5811.045; p<0.05).
We faced a serious dilemma when we wanted to determine the number of the factors. There were several methods to calculate it.
According to the Kaiser criterion, the number of the factor variables depends on the at least 1 eigenvalue limit. In our case, this means 12 factor variables. According to the professional literature (Sajtos – Mitev, 2007), it is reasonable to apply this method if the item number is between 20 and 50. In our case, this applies.
According to the proportion of variance method, one should select as many factors as needed to reach the minimum of the explained variance. For social scientific researches, this is 60 percent. By applying this method, we will gain 12 factors (explained variance 60.044%, eigenvalue 1.009).
The Scree Plot figure, too, helps to determine the number of factors. According to the elbow rule, the number of factors can be read from the curve where its gradient changes radically to become horizontal. In our case, this means a number between 6 and 10.
Finally, we applied the maximum-likelihood method, which, taking the correlation between the items into consideration, defines an insertion indicator. In our case, the number of factors is 14 (Table 4). This method is limited in that it is highly sensitive in terms of the deviation of the variables from multivariate normality. In our case, this applies strongly.
Table 4: The insertion indicators determined by the maximum-likelihood method
|
|
12 factors |
13 factors |
14 factors |
|
Khí-square |
721.318 |
653.279 |
583.338 |
|
Degree of freedom (df) |
618 |
582 |
547 |
|
Significance |
0.002 |
0.021 |
0.137 |
So, according to the above, it is not very easy for us to determine the number of factors, also with special respect to the fact that the MITB model counts with 8 variables (Figure 2), and all the data above stipulate much higher numbers of factors. However, we must not forget about the essence of the circumplex model, i.e. that one item can belong to several factors (Figure 2). This is also confirmed by Table 5.
Finally, we decided to apply the principal component analysis; when determining the principal components (factors), we used an a priori method and decided that the number of factors would be 8, but we also strived so that the cumulated variance proportion would approach the 60 per cent minimum level expected in social scientific researches; it was finally 51.203 percent. For variable compression, we applied the principal component analysis and then used the well-tried Varimax process (Table 5).
Figure 2: The circumplex approach
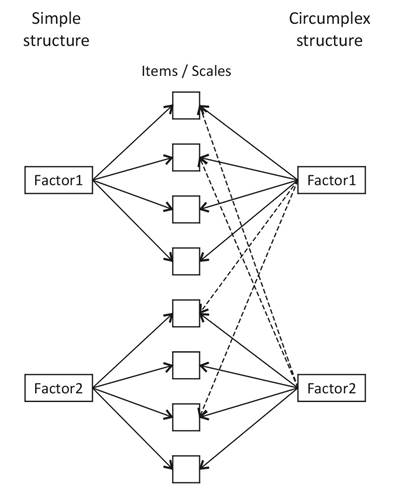
Source: Own figure
Table 5: Rotated Component Matrix
|
|
Component |
|
|||||||
|
F1 |
F2 |
F3 |
F4 |
F5 |
F6 |
F7 |
F8 |
|
|
|
CS10 |
,727 |
|
|
|
|
|
|
|
|
|
CS14 |
,663 |
|
|
|
|
|
|
|
|
|
CD25 |
,647 |
|
|
|
|
|
|
,281 |
|
|
CD45 |
,621 |
|
|
,215 |
-,209 |
|
|
|
|
|
CD33 |
,587 |
|
|
|
-,350 |
|
,216 |
|
|
|
DC5 |
,569 |
-,304 |
|
|
|
|
|
|
|
|
DC1 |
,565 |
|
|
|
|
|
|
|
|
|
CS22 |
,564 |
-,271 |
|
|
|
|
|
,246 |
|
|
DC21 |
,558 |
-,271 |
|
|
|
|
|
|
|
|
CS18 |
,550 |
|
|
|
|
-,406 |
|
|
|
|
DC9 |
,548 |
-,302 |
|
|
|
|
|
-,367 |
|
|
DC13 |
,545 |
|
|
|
|
|
|
|
|
|
DC17 |
,532 |
|
|
|
,233 |
|
|
|
|
|
CD29 |
,500 |
|
|
,331 |
-,267 |
|
|
|
|
|
CS6 |
,494 |
|
|
|
-,233 |
|
,322 |
|
|
|
CS2 |
,468 |
|
|
,242 |
|
|
-,206 |
|
|
|
SO7 |
|
,748 |
|
|
|
|
|
|
|
|
SO3 |
|
,728 |
|
|
|
|
|
|
|
|
OD20 |
|
,701 |
|
|
|
|
|
|
|
|
OD16 |
|
,650 |
|
|
|
|
|
|
|
|
SO23 |
|
,638 |
|
|
|
|
|
|
|
|
OD8 |
|
,620 |
,224 |
|
|
|
|
|
|
|
OD4 |
|
,610 |
|
|
|
|
|
-,279 |
|
|
SO15 |
|
,540 |
|
|
|
|
|
|
|
|
SO19 |
|
,511 |
|
|
,290 |
|
|
,252 |
|
|
SO11 |
|
,491 |
|
|
,256 |
|
|
,320 |
|
|
SC30 |
|
,361 |
|
,338 |
|
|
,360 |
,359 |
|
|
DO44 |
|
|
,782 |
|
|
|
|
|
|
|
DO40 |
|
|
,743 |
|
|
|
|
|
|
|
DO28 |
|
|
,739 |
|
|
|
|
|
|
|
DO36 |
|
|
,670 |
|
|
|
|
|
|
|
DO48 |
|
|
,600 |
|
,268 |
|
|
|
|
|
DO32 |
|
|
,593 |
|
|
|
-,202 |
|
|
|
SC46 |
|
,330 |
-,447 |
,251 |
|
|
,213 |
|
|
|
CD41 |
,227 |
|
|
,743 |
|
|
|
|
|
|
CD37 |
,276 |
|
|
,709 |
|
|
|
|
|
|
SC42 |
|
|
|
,556 |
-,201 |
|
,319 |
|
|
|
OS39 |
|
,359 |
|
|
,669 |
|
|
|
|
|
OS31 |
|
,353 |
,213 |
|
,534 |
|
|
|
|
|
OS47 |
|
,331 |
|
|
,432 |
,401 |
|
|
|
|
OS43 |
|
|
|
|
,382 |
,348 |
|
|
|
|
OS27 |
|
|
|
|
|
,720 |
|
|
|
|
OD12 |
|
|
|
|
|
,583 |
-,275 |
,226 |
|
|
OS35 |
|
|
,226 |
|
,246 |
,530 |
|
|
|
|
SC26 |
|
,211 |
|
|
|
|
,644 |
|
|
|
SC34 |
|
|
|
,414 |
|
|
,607 |
|
|
|
OD24 |
-,217 |
,409 |
|
|
|
|
|
-,499 |
|
|
SC38 |
|
,333 |
|
,272 |
,328 |
|
|
,361 |
|
|
Extraction Method: Principal Component Analysis. Rotation Method: Varimax with Kaiser Normalization. |
|||||||||
|
a. Rotation converged in 11 iterations. |
|||||||||
In terms of five items (DC13, SO15, DC1, CS2, OS43), the gained communality values were low, which raised the question of excluding them from the survey; however, these did not have a significant influence on the final results. This was also proved by the fact that the explained variance increased only slightly (53.821%).
Taking the number of elements in the sample into consideration, as well, when explaining the factors, we determined 0.35 as the minimum value of factor weight. Considering the rotated component matrix, the relation of the items to the factor variable was really interesting. Some factors, like F3, for example, confirmed a QTI variable fully since the same items were assigned to them as the developers of the query thought to assign (factor weights fell between 0.593 and 0.782).
There are some factor variables in which the items of several original variables appear (e.g. F1 and F2), but some of the factor variables are difficult to be identified (like F6 and F7) because the factor weights of the items belonging to them distribute between several factor variables.
The certain factors are explained according to this (N= 336 persons):
Summarizing all the above, we can state that the factor analysis of the results gained during the pilot survey does not fully reflect the QTI variables. We explain the gained factors from the teacher interaction aspect like this:
From all this one can see that the five identified factor variables rather verify the poles of the two dimensions: willingness (F1 and F7) and reluctance (F2, F3 and F5) to cooperate.
Generalization of factor variables
During research, the question of how much the gained factors can be generalized in terms of the basic population always arises. This question can be answered by the cross-validation test of the factors. We divided the sample into two random parts and then compared the gained results. In both cases, we applied the principal component analysis and the varimax method for factor rotation and a priori took 8 as the number of factors.
The survey results of the two samples are presented in Table 6; the variables are apt for factor analysis in both part samples.
Table 6: Adequacy test results of the two sub-samples
|
|
Sub-sample A |
Sub-sample B |
|
KMO value |
0.789 |
0.804 |
|
Bartlett test – Khí-square |
3301.629 |
3671.983 |
|
Bartlett test – Degree of freedom (df) |
1128 |
1128 |
|
Bartlett test – Significance (p) |
0.000 |
0.000 |
The eigenvalue belonging to the 8 factors is 1.402 for the first subsample and the explained variance is 52.401% here, while these numbers are 1.321 and 52.559% for the second sub-sample.
Concerning the two subsamples, there is no significant difference in terms of assigning the variables to the factors; the rotated factor weights are similar (Table 7).
Table 7: Rotated factor weights of the two subsamples (detail)
|
|
Subsample A |
Subsample B |
|
DO44 |
0.756 |
0.834 |
|
DO40 |
0.742 |
0.742 |
|
DO28 |
0.737 |
0.730 |
|
DO36 |
0.661 |
0.659 |
|
DO32 |
0.642 |
0.552 |
|
DO48 |
0.579 |
0.652 |
The factors were saved into variables in terms of both subsamples, and the values gained this way were examined by correlation analysis. The correlation values between the factors are indicated in Table 8. As for the first three factors, we found a strong correlation between the subsamples, and the same applies to F7. There are some permuted factors, as well, like F4A – F5B, F5A – F6B and F8A – F4B. Factor F6A has the most complex system of connections.
Table 8: The Pearson correlation coefficients between two subsamples
|
|
F1B |
F2B |
F3B |
F4B |
F5B |
F6B |
F7B |
F8B |
|
F1A |
0.881** |
|
|
-0.286** |
|
|
|
|
|
F2A |
|
0.878** |
|
|
|
|
|
|
|
F3A |
|
|
0.984** |
|
|
|
|
|
|
F4A |
|
|
|
0.353** |
0.956** |
|
|
|
|
F5A |
|
|
|
|
|
0.894** |
-0.248* |
|
|
F6A |
-0.334** |
0.526** |
|
-0.305** |
|
|
|
0.576** |
|
F7A |
|
-0.362** |
|
|
|
|
0.803** |
|
|
F8A |
|
|
|
0.573** |
|
|
|
|
** Correlation is significant at the 0.01 level (2-tailed).
* Correlation is significant at the 0.05 level (2-tailed).
Considering all the above, we can state that the 48-item version of the QTI can be accepted as valid.
Descriptive statistical indicators of the QTI variables and their comparison by background variables
Finally, we present in brief the descriptive statistical indicators of the QTI variables gained in terms of the 336 students. These are summarized in Table 9 and depicted in Figure 3. Based on these, it can be asserted that according to the opinions of the teacher students of the Carpathian Basin, ideal teacher interactions are characterized by high values of directing, resolute, helpful, friendly and understanding, open-to-consent attitudes and low values of uncertain, undecided, dissatisfied, doubtful and rebuking and warning attitudes. It is only the imposing (DO) – permissive (SC) dimension where opinions are distributed (deviation is the highest in these two cases) concerning the ideal teacher interaction. It is not by chance that we can see normal distribution regarding these two variables.
The certain QTI variables were also examined in terms of the following background variables: sex (bv1), type of training (bv2) and type of school (bv3). As for the variables DC, SO, CS, OD, CD and OS, we used the Mann-Whitney test, while for DO and SC, we applied the ANOVA test. Table 10 presents the averages and deviation of the subsamples by background variables.
Table 9: Descriptive statistical indicators of QTI variables
|
|
DC |
CD |
CS |
SC |
SO |
OS |
OD |
DO |
|
M |
4.4985 |
4.4648 |
4.4469 |
2.7688 |
1.3557 |
1.6235 |
1.5918 |
2.7604 |
|
SD |
0.4142 |
0.4452 |
0.4389 |
0.5531 |
0.4987 |
0.5242 |
0.4828 |
0.6627 |
|
95% CI lower |
4.4541 |
4.4170 |
4.3998 |
2.7095 |
13021 |
1.5673 |
1.5400 |
2.6893 |
|
95% CI upper |
4.5430 |
4.5126 |
4.4940 |
2.8282 |
1.4092 |
1.6798 |
1.6436 |
2.8315 |
|
5 percentile |
3.6667 |
3.6667 |
3.6667 |
1.8083 |
1.0000 |
1.0000 |
1.0000 |
1.6667 |
|
10 percentile |
3.8333 |
3.8333 |
3.8333 |
2.0000 |
1.0000 |
1.0000 |
1.1667 |
1.9500 |
|
25 percentile |
4.1667 |
4.1667 |
4.1667 |
2.5000 |
1.0000 |
1.1667 |
1.3333 |
2.3333 |
|
50 percentile |
4.6667 |
4.6667 |
4.6667 |
2.8333 |
1.1667 |
1.5000 |
1.5000 |
2.7500 |
|
75 percentile |
4.8333 |
4.8333 |
4.8333 |
3.1667 |
1.5000 |
1.8333 |
1.8333 |
3.1667 |
|
90 percentile |
5.0000 |
5.0000 |
5.0000 |
3.3333 |
1.8333 |
2.3333 |
2.1667 |
3.5500 |
|
95 percentile |
5.0000 |
5.0000 |
5.0000 |
3.6667 |
2.5000 |
2.6667 |
2.5250 |
4.0000 |
|
Normal distribution |
- |
- |
- |
+ |
- |
- |
- |
+ |
Figure 3: The circumplex perspective
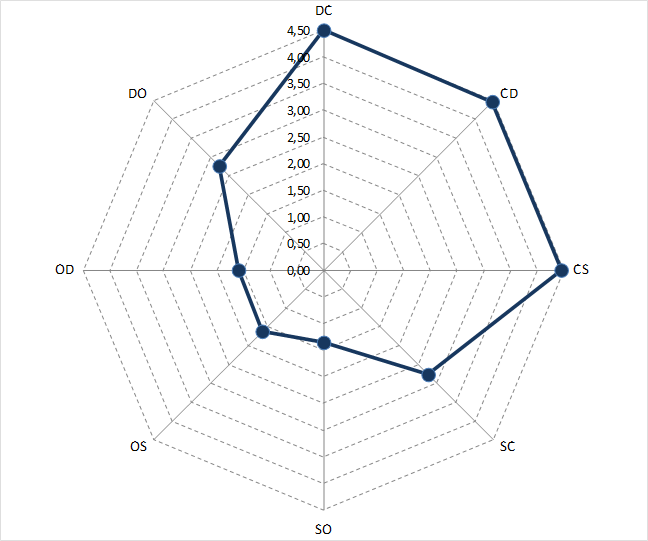
Source: Own figure
Table 10: The averages and deviation of the QTI octants by background variables
|
|
DC |
CD |
CS |
SC |
SO |
OS |
OD |
DO |
|
Whole sample M |
4,4985 |
4,4648 |
4,4469 |
2,7688 |
1,3557 |
1,6235 |
1,5918 |
2,7604 |
|
Whole sample SD |
0,4142 |
0,4452 |
0,4389 |
0,5531 |
0,4987 |
0,5242 |
0,4828 |
0,6627 |
|
Male M |
4,4010 |
4,2881 |
4,1864 |
2,7994 |
1,5113 |
1,7966 |
1,8051 |
3,0028 |
|
Male SD |
0,4422 |
0,5008 |
0,5450 |
0,5403 |
0,7077 |
0,6026 |
0,6782 |
0,6503 |
|
Female M |
4,5193 |
4,5024 |
4,5024 |
2,7623 |
1,3225 |
1,5866 |
1,5463 |
2,7088 |
|
Female SD |
0,4058 |
0,4240 |
0,3921 |
0,5566 |
0,4362 |
0,4995 |
0,4177 |
0,6550 |
|
Full-time M |
4.4888 |
4,4319 |
4,4190 |
2,7553 |
1,3515 |
1,6121 |
1,5833 |
2,7412 |
|
Full-time SD |
0,4041 |
0,4425 |
0,4441 |
0,5460 |
0,4845 |
0,5103 |
0,4974 |
0,6602 |
|
Correspondence M |
4,5513 |
4,6442 |
4.5994 |
2,8429 |
1,3782 |
1,6859 |
1,6378 |
2,8654 |
|
Correspondence SD |
0,4662 |
0,4201 |
0,3781 |
0,5908 |
0,5746 |
0,5965 |
0,3943 |
0,6732 |
|
Technical school M |
4,5038 |
4,4234 |
4,4473 |
2,7500 |
1,4071 |
1,6734 |
1,6149 |
2,7328 |
|
Technical school SD |
0,4199 |
0,4651 |
0,4490 |
0,5354 |
0,5747 |
0,5591 |
0,5452 |
0,6373 |
|
Grammar school M |
4,4928 |
4,5093 |
4,4465 |
2,7891 |
1,3004 |
1,5700 |
1,5669 |
2,7901 |
|
Grammar school SD |
0,4092 |
0,4196 |
0,4291 |
0,5725 |
0,3957 |
0,4800 |
0,4055 |
0,6897 |
While making comparisons in terms of the students’ genders, we found that, except for the variables SC and SO, there were significant differences concerning the sexes (DC: Mann-Whitney U=6761.000; p=0.035; CD: Mann-Whitney U=6140.000; p=0.002; CS: Mann-Whitney U=5303.000; p=0.000; OS: Mann-Whitney U=6482.500; p=0.012; OD: Mann-Whitney U=6533.500; p=0.014; DO: Levene Stat.=0.107; p=0.743; F=9.828; p=0.002).
We compared the students’ preferences in terms of the type of training (full-time, correspondence), as well. We found that there were only two variables, CD and CS, that bore significant differences (CD: Mann-Whitney U=5207.500; p=0.001; CS: Mann-Whitney U=5549.500; p=0.004). As for the type of the students’ secondary schools, we found no significant differences.
Summing up all of the above, we can state that from the three presented background variables, variance can be best explained by the students’ sexes. Concerning the DO variable, explained variance rate is h2=16.9%.
Table 11 presents the correlation system of the QTI variables in our research (right from the diagonal) comparing it to the results gained in a research done with the involvement of the students (of informatics and management) of a private university in Jakarta (Indonesia) (left from the diagonal) (Fraser et al., 2010). The biggest divergences are shown in italics.
Table 11: The Spearman correlation between the QTI octants
|
|
DC |
CD |
CS |
SC |
SO |
OS |
OD |
DO |
|
DC |
|
0.489** |
0.645** |
-0.077 |
-0.326** |
-0.180** |
-0.258** |
0.110 |
|
CD |
0.60** |
|
0.579** |
0.273** |
0.203** |
-0.277** |
-0.165** |
-0.067 |
|
CS |
0.49** |
0.51** |
|
0.039 |
-0.276** |
-0.372** |
-0.324** |
-0.102 |
|
SC |
-0.25** |
-0.17** |
-0.06 |
|
0.327** |
0.088 |
0.199** |
-0.168** |
|
SO |
-0.42** |
-0.33** |
-0.40** |
0.69** |
|
0.279** |
0.444** |
-0.045 |
|
OS |
-0.26** |
-0.41** |
-0.62** |
0.35** |
0.75** |
|
0.459** |
0.321** |
|
OD |
-0.04 |
-0.34** |
-0.83** |
-0.31** |
0.20** |
0.68** |
|
0.183** |
|
DO |
0.34** |
0.17** |
0.18** |
-0.21** |
-0.11* |
0.12* |
0.25** |
|
** Correlation is significant at the 0.01 level (2-tailed).
* Correlation is significant at the 0.05 level (2-tailed).
Within the MITB model presented in Figure 1, the octants or prototypes next to each other have, in theory, negative correlation while those opposite to each other are in strongly negative correlative relation, and the prototypes taking an orthogonal position to each other have, in theory, no correlative relation. (Wubbels et al., 2012; Wubbels, 2014). Regarding our results, the variables opposite to each other have medium-strong negative relation with one exception (DO-CS: r=-0,168), while those next to each other have strong positive relation with one or two exceptions (DO-DC: r=0,11; CS-SC: r=0,039; DO-OD: r=0,183). As for the octants taking orthogonal positions, the picture gained has been rather mixed both in terms of our own research and the one implemented in Indonesia: there have been hardly any cases of correlation coefficients taking a value around zero. Our research found a correlation coefficient close to zero only in terms of DO – CD and SC – OS, while the Indonesian research did so in terms of OD – DC.
We checked up on this issue in two other researches, as well. The researches done by Stefano Passini et al (2015) with Italian secondary school pupils and by Zainun Misbah et al (2015) with students in agrarian vocational training found similar outcomes. The latter one provided weirdly similar results in this dimension. Table 12 presents the correlation values of the variables taking orthogonal positions from the four researches mentioned above.
Table 12: Correlation between the QTI octants taking orthogonal positions
|
|
Own research |
Research by Fraser et al. |
Research by Passini et al. |
Research by Misbah et al. |
|
DO – CD |
-0.067 |
0.17** |
-0.22** |
-0.03 |
|
DC – CS |
0.645** |
0.49** |
0.69* |
0.52** |
|
CD – SC |
0.273** |
-0.17** |
0.48* |
0.20** |
|
CS – SO |
-0.276** |
-0.40** |
-0.30* |
-0.14** |
|
SC – OS |
0.088 |
0.35** |
-0.31* |
0.02 |
|
SO – OD |
0.444** |
0.20** |
0.11** |
0.40** |
|
OS – DO |
0.321** |
0.12 |
0.37* |
0.47** |
|
OD – DC |
-0.258** |
-0.04 |
-0.26* |
-0.12** |
** Correlation is significant at the 0.01 level (2-tailed).
* Correlation is significant at the 0.001 level (2-tailed).
All in all, we can declare that both our research and those implemented abroad give only partial proof of the correlation contact system between the variables of the MITB model developed by Wubbles, and this particularly applies for the variables taking right angle positions to each other.
Summary
Our research aimed to develop the Hungarian version of the QTI query. The original version of the query was elaborated by Wubbles et al. in the middle of the 1980s in order to examine interpersonal teacher behaviour. This query has been used in several types of research all over the world.
In the background of the QTI we find the MITB model developed by Wubbels et al. that was based on Leary’s circumplex model on the one hand and Watzlawick – Beavin – Jackson’s communication model on the other.
Leary (2004) explained five levels of the social-interpersonal behaviour of personality. He elaborated 128-item queries (ICL) only for levels I., II. and V. These also served as a base for compiling the original QTI.
In the second part of our study, we presented the results we had achieved during the adaption of the QTI query to the Hungarian language. Our research involved students from Hungarian speaking teacher training in the Carpathian Basin. We asked them about the ideal teacher interaction that corresponds to level V. of the original Wubbels model (self-ideal) during the survey.
In our paper, we found that the Hungarian version of the QTI query was valid, reliable and verified the circumplex model well.
References
· Amidon, E. J., & Hough, J. B. (Eds.) (1967): Interaction analysis: Theory, research, and application. Reading: Addison, Wesley.
· Bacete, F. J. G., Ferrá, P., Monjas, M. I. & Marande, G. (2014): Teacher-Students Relationships in First and Second Grade Classrooms. Adaptation of the Questionnaire on Teacher Interaction-Early Primary (QTI-EP). Revista de Psicodidáctica, 19(1), p211-231.
· Balázsné Csuha, M. (1993): Személyiségfejlesztő csoportmunka tapasztalatai a pedagógusképzésben a Leary-féle interperszonális lista alapján. Eger: Acta Academiae Paedagogicae Agriensis Nova Serie Tom. XXI. Az Eszterházy Károly Tanárképző Főiskola Tudományos Közleményei.
· Bartha, Cs. & Hámori, Á. (2010): Stílus a szociolingvisztikában, stílus a diskurzusban. Magyar Nyelvőr, 134(3), p298-321.
· Bartholomew, K. & Horowitz, L. M. (1991): Attachment styles among young adults: a test of a four-category model. Journal of Personality and Social Psychology, 61(2), p226–244.
· Buch, M. B. & Santhanam, Ms. R. (1970): The Classroom Verbal Behaviour of Selected Teachers in Baroda Secondary Schools. In: M.B. Buchand – Ms. R. Santhanam (Eds.). Communication in Classroom. Baroda: CASE, Faculty of Education and Psychology.
· Buda, B. (1986): A közvetlen emberi kommunikáció szabályszerűségei. Budapest: Animula Kiadó.
· Carson, R. (1969): Interaction concepts of personality. Chicago: Aldine.
· Carver, Ch. S. & Scheier, M. (2006): Személyiségpszichológia. Budapest: Osiris Kiadó.
· Csehi, A., Kanczné Nagy, K. & Tóth-Bakos, A. (2020): Experience education to alleviate fears of educator candidates in their university studies. AD ALTA Journal of Interdisciplinary Research, 10(2), p170-175.
· Czvik, É. & Sziszik, E. (2004): Kísérleti tapasztalatok a kompetencia fejlesztéséről. Budapest: ELTE. Pedagógiai és Pszichológiai Kar. Tanárképző és továbbképző Központ.
· Demetrovics, Zs. (2007): Drog, család, személyiség. Különböző típusú drogok használatának személyiségpszichológiai és családi háttere. Budapest: Nemzeti Drogmegelőzési Intézet.
· den Brok, P., Brekelmans, M. & Wubbels, T. (2004): Interpersonal teacher behaviour and Student Outcomes. School Effectiveness and School Improvement. 15(3-4), p407-442.
· Dóra, L. (2014): A Bales-féle csoportos interakció folyamatelemzés. Iskolakultúra, 24(6), p17-30.
· Dorman, J. P. (2003): Cross-national validation of the What Is Happening In this Class questionnaire using confirmatory factor analysis. Learning Environments Research, 6, p231-245.
· Dunkin, M. J. & Biddle, B. J. (1974): The study of teaching. Holt: Rinehart & Winston.
· Eckert, P. & McConnell, G. (1995): Constructing meaning, constructing selves: Snapshots of language, gender and class from Belten High. In: Buchholtz, M. – Hall, K. (eds.). Gender Articulated. Language and the Socially Constructed Self. New York–London: Routledge, p469–507.
· Erickson, F. (2006): Definition and Analysis of Data from Videotape: Some Research Procedures and Their Rationales. In: Green, J. L. - Camilli, G. - Elmore, P. B. (Eds.). Handbook of Complementary Methods in Education Research. p177-191.
· Flanders, N. A. (1966): Interaction Analysis in the Classroom – A Manual for the Observers. Michigan: School of Education, University of Michigan.
· Flanders, N. A. (1977): Interaction analysis and inservice training. In: Morrison-McIntyre (Eds.): The social psychology of teaching. Middlesex: Penguin Books Ltd., p63-73.
· Fraser, B. J., Aldridge, J. M., Soerjaningsih, W. (2010): Instructor-Student Interpersonal Interaction and Student Outcomes at the University Level in Indonesia. The Open Education Journal, 3, p21-33
· Fisher, D., Fraser, B. & Creswell, J. (1995): Using the Questionnaire on Teacher Interaction in the Professional Development of Teachers. Australian Journal of Teacher Education, 20(1). Elérhető: http://dx.doi.org/10.14221/ajte.1995v20n1. Letöltve. 2018.08.02.
· Fisher, D. & Rickards, T. (1998): Associations between Teacher-Student Interpersonal Behaviour and Student Attitude to Mathematics. Mathematics Education Research Journal, 10(1), p3-15.
· Fodor, L. (2003): A kommunikáció alapjai. Budapest: Perfekt Oktató és Kiadó Zrt.
· Forgács, J. (1993): A társas érintkezés pszichológiája. Budapest: Gondolat Kiadó.
· Forgó, S. (2001): Kommunikációelmélet. Eger: EKF. Líceum Kiadó.
· Fraser, B. J. (1994): research on classroom and school climate. In: Gabel, D. (Ed.): Handbook of Research on Science Teaching and Learning. New York: Macmillan, p493-541.
· Fraser, B., Aldridge, J., M. & Soerjaningsih, W. (2010): Instructor-Student Interpersonal Interaction and Student Outcomes at the University Level in Indonesia. The Open Education Journal, 3, p21-33.
· Gavora, P., Mareš, J. & den Brok, P. (2003): Adaptácia Dotazníka interakčného stylu učiteľa. Pedagogická revue, 55(2), p126-145.
· G. Donáth Blanka (1975): A tanár-diák kapcsolatról. Budapest: Tankönyvkiadó.
· Goh, S. C. & Fraser, B. J. (1998): Teacher Interpersonal Behaviour, Classroom Environment and Student Outcomes in Primary Mathematics in Singapore. Learning Environments Research, 1(2), p199-229.
· Greeno, J. G. (2006): Theoretical and Practical Advances Through Research on Learning. In: Green, J. L., Camilli, G. & Elmore, P. B. (Eds.). Handbook of Complementary Methods in Education Research, p795-822.
· Horváth, Gy. (1997): A modern tesztmodellek alkalmazása. Budapest: Akadémiai Kiadó.
· Jónás, F. (2010): Interakció a magyar mint idegen nyelvben. Alkalmazott Nyelvészeti Közlemények, p121-129.
· Jordan, B. – Henderson, A. (1995): Interaction Analysis: Foundation and Practice. The Journal of the Learning Sciences. 4(1), p39-103
· Kelley, H. H. & Thibaut, J. W. (2011): The social psychology of groups. London: Nabu Press.
· Kiesler, D. J. (1983): The 1982 Interpersonal Circle: A Taxonomy for Complementarity in Human Transactions. Psychological Review, 90, p185-214.
· Kožený, J. – Ganický, P. (1976): Přiručka pro administraci, interpretaci a vyhodnocování testu. Psychodiagnostické a didaktické testy. Bratislava.
· Kövérová. M. (2015): Percepcia interakčného štýlu učiteľa a subjektívna pohoda študentov. Psychologie a její kontexty 6(1), p33–48.
· Kulcsár, Zs. (1981): Leary teszt. Timothy Leary: A személyiség interperszonális diagnózisa c. könyve alapján. Pszichológiai tanácsadás a pályaválasztásban. Módszertani füzetek. Országos Pedagógiai Intézet, Budapest.
· Lang, Q. Ch., Wong, A. F. L. & Fraser, B. J. (2005): Teacher-Student Interaction and Gifted Students’ Attitudes Toward Chemistry in Laboratory Classrooms in Singapore. Journal of Classroom Interaction, 40(1), p18–28.
· Leary, T. (2004): Interpersonal Diagnosis of Personality: A Functional Theory and Methodology for Personality Evaluation. Eugene: Wipf & Stock Pub, (Az első kiadás 1957-ben jelent meg a John Wiley & Sons-nál.)
· Lengyel, Zs. (1997): Szociálpszichológia. Budapest: Osiris Kiadó.
· Li, H. Q. & Wu, Y. Z. (2011): Comparative Study on the Personality Patterns of „Good Teacher” and „Bad Teacher” as Perceived by College Students. Advanced Materials Research, Vols. 271-273, p760-763.
· Lukas, J. (2005): Zkušenosti se zjišťováním interakčních stylu učitelu na 2. stupni ZŠ. In: Mareš, J. & Svatoš, T. Novinky v pedagogické a školní psychologii. Hradec Králové: ESF, IPPP ČR a SR, p29-43. Elérhető: http://www.jlukas.cz/doc/pedagogicka/zkusenosti_se_zjistovanim_interakcnich_stylu.pdf. Letöltve: 2018.07.30
· Lukas, J. (2010): Dotazník QTI a možnosti jeho využití školními psychology. Brno: Školní psycholog., AŠP SR a ČR, 2010/12, p1-2.
· Lukas, J. & Šerek, J. (2009): Předběžné výsledky standardizace dotazníku QTI pro II. stupeň českých základních škol. In: Sociálne procesy a osobnosť 2008. Bratislava: Zborník z konferencie. Ústav experimentálnej psychológie SAV, p786-797.
· Mareš, J. & Gavora, P. (2004): Interpersonální styl učitelu: teorie, diagnostika a výsledky výzkumu. Pedagogika. Roč. LIV. 2004/2. p101-128.
· Mead, G. H. (1934): Mind, self & society. Chicago: The University of Chicago Press. (2015-ben megjelent a reprint kiadás, melynek szerkesztője Charles W. Morris.)
· Mehan, H. (1979): Learning lessons. Cambridge: Harvard University Press.
· Misbah, Z., Gulikers, J., Maulana, R. & Mulder, M. (2015): Teacher interpersonal behaviour and student motivation in competence-based vocational education: Evidence from Indonesia. Teaching and Teacher Education, 50, p79-89.
· Moos, R. H. (1979): Evaluating Educational Environments: Procedures, measures, findings and policy implications. San Francisco: Jossey-Bass.
· Moos, R. H. (1978): A typology of junior high and high school classrooms. American Educational Research Journal, 15, p53-66.
· Passini, S., Molinari, L. & Speltini, G. (2015): A validation of the questionnaire on teacher interaction in Italian secondary school students: the effect of positive relations on motivation and academic achievement. Social Psychology of Education, 18(3), p547-559.
· Pietromonaco, P. R. & Barrett, L. F. (1997): Working models of attachment and daily social interactions. Journal of Personality and Social Psychology, 73(6), p1409–1423.
· Raufelder, D., Nitsche, L., Breitmeyer, S., Kessler, S., Herrmann, E. & Regner, N. (2016): Students’ perception of “good” and “bad” teachers — Results of a qualitative thematic analysis with German adolescents. International Journal of Educational Research, 75, p31-44.
· Sallay, H. (1995): Tanári szerepek percepciója: egy általános iskolai felmérés tanulságai. Magyar Pedagógia, 95, p3-4.
· Síklaki, I. (1998): A tanári dominancia buktatói. A feleltetés szociolingvisztikai elemzése. Iskolakultúra. 1998/10, p42-56.
· Stodolsky, S. S. (1988): The subject matters: Classroom activity in math and social studies. Chicago: University of Chicago Press.
· Sullivan, H. S. (1968): The Interpersonal Theory of Psychiatry. New York: W. W. Norton & Company.
· Szitó, I. (2003): Kommunikáció az iskolában. Iskolapszichológia. 7. kötet. Budapest: ELTE Eötvös Kiadó.
· Takács, Sz. & Kárász, J. (2014): Egy egyszerű, újfajta kereszt-validálási eljárás bemutatása. Psychologia Hungarica, 2(1), p65-77.
· Telli, S., den Brok, P. & Cakiroglu, J. (2007): Teacher-student Interpersonal Behavior in Secondary Science Classes in Turkey. Journal of Classroom Interaction, 41(2), p31-40.
· Tóth-Bakos, A. & Tóth, P. (2018): A lemorzsolódás-kutatás pilot vizsgálatának eredményei a Selye János Egyetemen. In: Tóth, P., Maior, E., Horváth, K., Kautnik, A., Duchon, J. & Sass, B. (szerk.). Kutatás és innováció a Kárpát-medencei oktatási térben, online: http://tmpk.uni-obuda.hu/letoltes/K-MOK-20180622-Toth_Peter-Maior_Eniko-Horvath_Kinga-Kautnik_Andras-Duchon_Jeno-Sass_Balint_(szerk)-Kutatas_es_innovacio_a_Karpat-medencei_oktatasi_terben.pdf
· Tóth, L. (2000): Pszichológia a tanításban. Debrecen: Pedellus Tankönyvkiadó.
· Vašíčková, S. (2015): Správa z merania interakčného štýlu učiteľa. Výskum sprievodných aspektov vzdelávania. Bratislava: NÚCEM. Elérhető: http://www.nucem.sk Letöltve: 2019.02.14.
· Walberg, H. J. (Ed.) (1979): Educational environments and effects: Evaluation, policy, and productivity. Berkeley: McCutchan.
· Watzlawick, P., Beavin, J. & Jackson, D. (1967): The pragmatics of human communication. New York: Norton.
· Watzlawick, P., Weakland, J., H. & Fisch, R. (1974): Változás. A problémák keletkezésének és megoldásának elvei. Budapest: Animula Kiadó.
· Wiggins, J. S., Phillips, N. & Trapnell, P. (1989): Circular reasoning about interpersonal behavior: Evidence concerning some untested assumptions underlying diagnostic classification. Journal of Personality and Social Psychology, 56(2), p296-305.
· Wiggins, J. S. & Trobst, K. K. (1997): Prospects for the assessment of normal and abnormal interpersonal behavior. Journal of Personality Assessment, 68(1), p110-126.
· Wubbels, T., Créton, H. A. & Hooymayers, H. P. (1985): Discipline problems of beginning teachers, interactional teacher behavior mapped out. Chicago: The annual meeting of the American Educational Research Association. Elérhető: http://files.eric.ed.gov/fulltext/ED260040.pdf Letöltve: 2018.08.01.
· Wubbels, T., Créton, H. A. & Hooymayers, H. P. (1987): A School‐based Teacher Induction Programme. European Journal of Teacher Education, 10(1), p81-94.
· Wubbels, T., Brekelmans, M. & Hooymayers, H. (1991): Interpersonal teacher behavior in the classroom. In: Fraser, B. J. – Walberg, H. J. (Eds.). Educational environments: Evaluation, antecedents and consequences. Elmsford: Pergamon Press, p141-160.
· Wubbels, T. & Levy, J. (1991): A comparison of interpersonal behaviour of Dutch and American teachers. International Journal of Intercultural Relations, 15, p1-18.
· Wubbels ,T., Creton, H. A. & Hooymayers, H. P. (1992): Review of research on teacher communication styles with use of the Leary model. Journal of Classroom Interaction, 27, p1-12.
· Wubbels, T. & Levy, J. (1993): Do you know what you look like? Interpersonal relationships in education. London: Falmer Press.
· Wubbels, T. & Brekelmans, M. (1998): The teacher factor in the social climate of the classroom. In: Fraser, B. J. & Tobin, K. G. (Eds.). International handbook of science education. Dordrecht: Kluwer Academic, p564-580.
· Wubbels, T., den Brok, P., van Tartwijk, J. & Levy, J. (2012): Interpersonal Relationships in Education: An Overview of Contemporary Research. Leiden: Sence Publishers.
· Wubbels, T. (2014): Teacher-student relationships in class: a future for research. Pedagogische Studien, 91(5), p352-363.
· Zahatňanská, M. & Nagy, M. (2020): An attempt to identify problems in the behaviour of teenagers and adolescents in Slovakia in relation to their creativity and success in the school. AD ALTA Journal of Interdisciplinary Research, 10(1), p326-329.
· Zagyváné, Szűcs I. (2016): Milyen a jó tanár? Tanulás és fejlődés. A IV. Neveléstudományi és Szakmódszertani Konferencia válogatott tanulmányai. p3-8.